It is very often possible to come across statements that statements made by a meme are supported by “research” or “science”. But when I start reading the research itself, it usually turns out that the data contradict the statements. Here are some fresh examples that I came across.
Dunning-Kruger effect
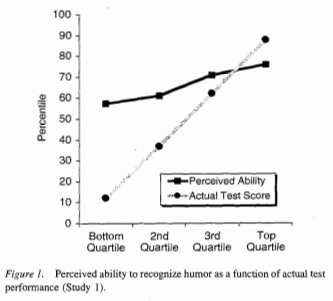
The popular science version of the Dunning-Kruger effect sounds so that the less someone knows something about the chosen topic, the more his knowledge seems to him. In fact, the statement of Dunning and Kruger is not so strong. The original scientific work is not longer than most of its incorrect popular science interpretations, and you can get an idea of the statements of scientists by studying four pictures from the article. On these graphs, the perceived ability, or perceived ability, denotes a subjective rating, and the actual ability, or real ability, is the result of a test.


In two cases out of the four, a positive correlation between perceived skills and real skills is evident, which contradicts the popular science concept of the Dunning-Kruger effect. A plausible explanation for why perceived skills are compressed, especially at the bottom of the graph, is that few people want to rate their skills as below average or as best. In the other two cases, the correlation is almost zero. It is possible that this effect works differently for different tasks, or that the sample is too small and that the difference between different tasks is within the limits of noise. This effect can also occur due to the specificity of the sample of subjects (students from Cornell, who probably demonstrate above-average skills in many areas). If we look at the description of the effect on Wikipedia, it will be written there that reproducing this experience in East Asia gave the opposite result (perceived skills are lower than real ones, and the more skill, the greater the difference), and that this effect is likely an artifact of American culture but the link leads to an article that mentions a meta-analysis of East Asian self-confidence, so this could be another example of incorrect citation. Or is it just the wrong link. In any case, this effect does not mean that the more people know, the less, in their opinion, their knowledge.
Income and happiness
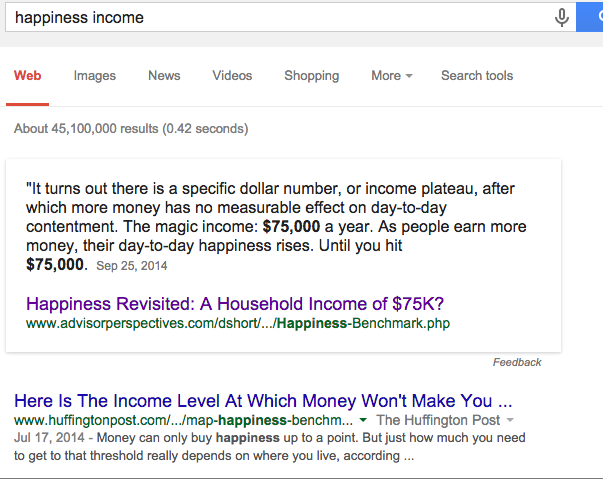
It is generally recognized that money does not make people happy. How much money should be enough depends on who you ask, but they usually talk about incomes of $ 10, $ 30, $ 40 and $ 75 thousand a year. At the moment, Google search shows that the amount after which the increase in income does not affect happiness is $ 75,000 per year.
Note Perev .: it is quite difficult to transfer their income to our realities. You can estimate the purchasing power of such a fairly popular method as the Big Mac Index, and then the approximate calculations will be as follows. If you believe the online calculator, then in the case of income of $ 75,000 per year, a person will receive an average of $ 53,500. In big maks, this will roughly correspond to the monthly (as we are more accustomed to count) income of 130,000 rubles "clean."
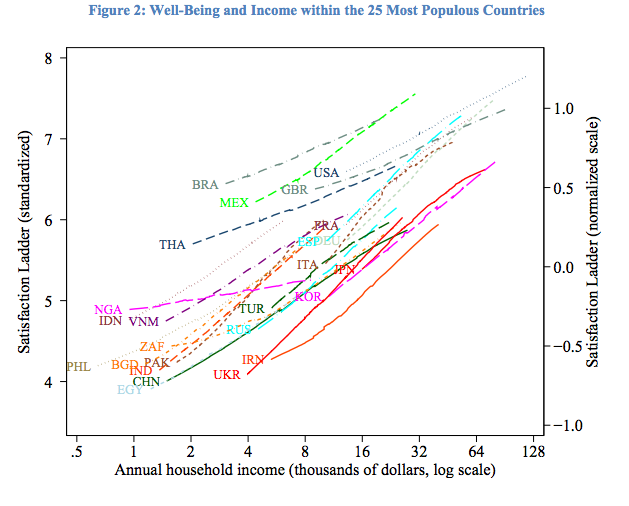
But this is not only wrong - this incorrectness is
preserved for all the countries studied .

The correlation of happiness and income exists, and it is not the result of any one specially selected study. The results are saved after five consecutive World Values Survey conducted during the periods 1981-1984, 1989-1993, 1994-1999, 2000-2004 and 2005-2009, three repetitions of surveys of the Pew Global Research Center (Pew Global Attitudes Survey) 2002, 2007, 2010, five repetitions of the International Social Survey Program for 1991, 1998, 2001, 2007, 2008 and a large study by Gallup.
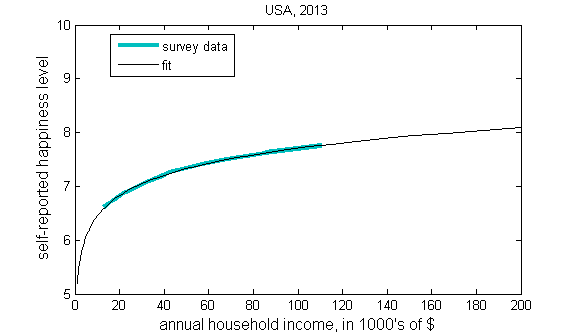
In the graph above, revenue is shown on a logarithmic scale. If you select a country and build a line graph, you will get
something like the following :

As with all logarithmic graphs, it seems that the curve is about to align and come up with something like this:

This is a real picture from an article that states that income does not make people happy. Similar, similar to logarithmic graphs, which are aligned with time, are quite common. Try google phrase "
happiness income ". My favorite article is one in which people who earn enough money are at the very top of the scale. Apparently, there is so much money that not only makes you happy, but makes you as happy as it is possible for a person.
As in the case of Dunning-Kruger, you can look at the graphics in scientific papers and see what's what. In this case, it is easier to understand why people are disseminating incorrect information, since it is quite easy to misunderstand data built on a linear scale.
Hedonic adaptation and happiness
The idea that people move away from trouble (and positive emotions) and return to a fixed level of happiness entered the popular mind after Daniel Gilbert described it in a
popular book .
But even without studying the literature on adaptation to adverse events, the previous section of the article may already raise certain questions to this idea. If people move away from unpleasant and pleasant events, how does an increase in income increase a person’s happiness?
It turns out that the idea of adapting to unpleasant events and returning to the previous level of happiness is a myth. Although specific effects vary depending on the nature of the event,
disability ,
divorce ,
loss of a partner ,
loss of work have a long-term effect on the level of happiness. Loss of work is easy to fix, but the effect of this event persists even after people re-find work. Here I cited only four studies, but a
meta-analysis of the literature shows that the results are confirmed in all known studies.
The same is true for pleasant events. Although it is generally accepted that winning the lottery does not make people happier,
it turns out that this is not so .
In both cases, early cross-sectional research results showed the likelihood that extreme cases, like winning a lottery or acquiring a disability, do not have a long-lasting effect on happiness. But longer studies that study certain individuals and measure the happiness of one person, while various events happen to him, show the opposite result - the events that take place affect happiness. These results are for the most part not new (some of them appeared even before the release of Daniel Gilbert’s book), but older results are based on less rigorous research and continue to spread faster than correcting new ones.
Type systems
Unfortunately, false statements about research and evidence are not limited to popular science memes. They are also found in software and hardware development.
Programmers who question the value of type systems are the technological equivalent of vaccination opponents.I observe such things at least once a week. I chose this example not because it is particularly blatant, but because it is typical. If you read the twitter of some ardent supporters of functional programming, you can periodically come across statements about the existence of serious empirical evidence and comprehensive research supporting the effectiveness of type systems.
However, a
review of empirical evidence shows that this evidence is for the most part incomplete, and at other times ambiguous. Of all the false memes, this one, in my opinion, is the hardest to understand. In other cases, I can imagine a plausible mechanism of how to misinterpret these results. “Communication is weaker than expected” may turn into “communication turned out to be opposite to expected”, the logarithm may be similar to the asymptotic function, and preliminary results obtained by dubious methods can be distributed faster than the subsequent and better completed studies. But I am not sure what is the relationship between evidence and opinion in this case.
Can this be avoided?
One can understand why false memes spread so quickly, even though they directly contradict a reliable source. Reading scientific papers can seem difficult. Sometimes it is. But often it is not. Reading purely mathematical work is usually tedious. Reading the empirical work that determines the reliability of a methodology can be difficult. For example, biostatistics and econometrics use completely different methods, and it is rather difficult to begin to understand well the set of methods used in a particular area in order to understand exactly where they can be applied and what disadvantages they have. But reading empirical works just to understand what they are saying is usually quite easy.
If you read the excerpt and conclusion, and then scroll through the work in search of interesting points (graphs, tables, methodological flaws, etc.), in most cases this will be enough to understand whether popular statements match what is written in work. In my ideal world, this could be understood by reading only an excerpt, but often the works indicate much more powerful statements in the extracts than those in the body of the work, therefore, the work should at least be scrolled through.
Maybe I'm naive, but I think that the main reason for the appearance of false memes is that checking sources seems more complicated and frightening than it actually is. A vivid example of this is an article in Quartz magazine about the absence of gender differences in wages in technological areas, in which
many sources were quoted
that stated the exact opposite . Twitter was buzzing with claims from people who said that gender difference was gone. When I published a post in which I simply quoted the very works that were cited, many of these people stated that their initial statement was wrong. It's good that they are ready to write a correction to their words, but as far as I can tell, none of them went and read the data themselves, although it was quite obvious from the graphs and tables how the author of the original article on Quartz promotes his opinion without even caring on the selection of articles suitable for him.