Analysis of a sales funnel is a typical task for internet marketing, and in particular e-commerce. With its help you can:
- Find out which of the steps to the purchase you are losing potential customers.
- To simulate the volume of additional revenue inflow, in case of expansion of each step on the way to purchase.
- Assess the quality of traffic purchased on various advertising platforms.
- Assess the quality of processing incoming applications for each of the managers.
In this article, I will talk about how to request data from the Yandex Metrics Logs API in R language, build and visualize a funnel based on them.
One of the main advantages of the R language is the presence of a huge number of packages that expand its basic functionality. In this article we will look at the rym , funneljoin and ggplot2 .
Using rym we load data from the Logs API, use funneljoin to build a behavioral funnel, and using ggplot2 visualize the result.

Content
Request data from Logs API Yandex Metrics
Who does not know what the Logs API is here is a quote from the official Yandex help.
The Logs API allows you to receive non-aggregated data collected by Yandex.Metrica. This API is intended for users of the service who want to independently process statistical data and use them to solve unique analytical problems.
To work with the Yandex.Metrica Logs API in R, we will use the rym package.
Useful links to the rym package rym - R package which is an interface for interacting with the Yandex Metrica API. Allows you to work with the Management API, the Reporting API, the Gore API compliant Google Analytics v3 and Logs API .
Rym package installation
To work with any package in R, it must first be installed and downloaded. Install a package once using the install.packages() command. It is necessary to connect the package in each new work session in R using the library() function.
To install and connect the rym package rym use the following code:
install.packages("rym") library(rym)
Working with Logs API Yandex Metrics using the rym package
To build behavioral funnels, we need to download a table of all visits made on your site, and prepare the data for further analysis.
Authorization in the Yandex Metrics API
Work with the API begins with authorization. In the rym package rym the authorization process is partially automated and starts when any of its functions is called.
The first time you access the API, you will be redirected to the browser to confirm permission to access your Yandex metrics for the rym package. After confirmation, you will be redirected to the page where an authorization confirmation code will be generated for you. It must be copied and pasted into the R console as a response to the "Enter authorize code:" request.
Next, you can save the credentials to a local file by answering y or yes to the request "Do you want save API credential in local file ..." . In this case, at the next calls to the API, you will not need to re-authenticate through the browser, and the credentials will be loaded from the local file.
Request data from Yandex Metrica API
The first thing we ask from the Yandex Metrics API is a list of available counters, and configured goals. This is done using the rym_get_counters() and rym_get_goals() functions.
# library(rym) # counters <- rym_get_counters(login = " ") # goals <- rym_get_goals("0000000", # login = " ")
Using the above code example, replace " " with your Yandex username, under which the Yandex metrics you need are available. And "0000000" to the number of the counter you need. You can see the numbers of the counters available to you in the loaded counters table.
Table of available counters - counters has the following form:
# A tibble: 2 x 9 id status owner_login name code_status site permission type gdpr_agreement_accepted <int> <fct> <fct> <fct> <fct> <fct> <fct> <fct> <int> 1 11111111 Active site.ru1 Aerosus CS_NOT_FOUND site.ru edit simple 0 2 00000000 Active site.ru Aerosus RU CS_OK site.ru edit simple 1
The id field shows the numbers of all available Yandex metric counters.
The goals table is as follows:
# A tibble: 4 x 5 id name type is_retargeting conditions <int> <fct> <fct> <int> <fct> 1 47873638 url 0 type:contain, url:site.ru/checkout/cart/ 2 47873764 url 0 type:contain, url:site.ru/onestepcheckout/ 3 47874133 url 0 type:contain, url:/checkout/onepage/success 4 50646283 action 0 type:exact, url:click_phone
Those. in the counter with which I work, the following actions are configured:
- Go to the basket
- Go to payment
- Thank you page for order
- Click on the phone button
In the future, for data conversion, we will use the packages included in the tidyverse library: tidyr , dplyr . Therefore, before using the following code example, install and connect these packages, or the entire tidyverse library.
# install.packages("tidyverse") # library(tidyverse) install.packages(c("dplyr", "tidyr")) library(dplyr) library(tidyr)
The rym_get_logs() function allows you to request data from the Yandex metrics Logs API metrics.
# logs <- rym_get_logs(counter = "0000000", date.from = "2019-04-01", date.to = "2019-06-30", fields = "ym:s:visitID, ym:s:clientID, ym:s:date, ym:s:goalsID, ym:s:lastTrafficSource, ym:s:isNewUser", login = " ") %>% mutate(ym.s.date = as.Date(ym.s.date), ym.s.clientID = as.character(ym.s.clientID))
The main arguments to the rym_get_logs() function rym_get_logs() :
- counter - counter number from which you request logs;
- date.from - start date;
- date.to - end date;
- fields - a list of fields that you want to load;
- login - Yandex login under which the counter specified in counter is available.
Thus, we requested visit data from the Logs API that contains the following columns:
- ym: s: visitID - Visit ID
- ym: s: clientID - User ID on the site
- ym: s: date - Date of visit
- ym: s: goalsID - Identifier of goals achieved during this visit
- ym: s: lastTrafficSource - Traffic Source
- ym: s: isNewUser - First visitor visit
For a complete list of available fields, see the Logs API Help .
The received data is enough for us to build a funnel, in connection with which the work with the Logs API is finished, and we move on to the next step - post-processing of the downloaded data.
Funnel construction funneljoin package
A significant part of the information provided in this section is obtained from the funneljoin README package, available by reference .
funneljoin goal is to simplify funnel analysis of user behavior. For example, your task is to find people who visited your site and then registered, and find out how much time has passed between the first visit and registration. Or you need to find users who viewed the product card and added it to the basket within two days. The funneljoin package and the after_join() function help to solve such problems.
Arguments after_join() :
- x - a set of data containing information on the completion of the first event (in the first example, visiting the site, in the second viewing the product card).
- y - a data set with information about the second event, (in the first example of registration, in the second, adding the product to the basket).
- by_time - a column containing information about the date the events occurred in tables x and y .
- by_user - a column with user identifiers in tables x and y .
- mode - the method used to connect: "inner", "full", "anti", "semi", "right", "left". Instead, you can also use
after_mode_join (for example, after_inner_join instead of after_join (..., mode = "inner") ). - type - the type of sequence used to define pairs of events, such as "first-first", "last-first", "any-firstafter". More details are described in the section "Funnel types".
- max_gap / min_gap (optional) - filter by the maximum and minimum duration of time between the first and second events.
- gap_col (optional) - Whether to return a numeric .gap column with a time difference between events. The default is FALSE.
Install funneljoin
At the time of this writing, the funneljoin package funneljoin not published on CRAN, so you can install it from GitHub. To install packages from GitHub you will need an additional package - devtools .
install.packages("devtools") devtools::install_github("robinsones/funneljoin")
Postprocessing data received from the Logs API
For a more detailed study of the funnel construction functional, we need to bring the data obtained from the Logs API to the desired form. The most convenient way to manipulate data, as I wrote above, is provided by the tidyr and dplyr .
To get started, do the following:
- In this case, one row of the logs table contains information about one visit, and the ym.s.goalsID column is an array of the form -
[0,1,0,...] , which contains identifiers of goals achieved during this visit. In order to bring the array to a form suitable for further work, it is necessary to remove extra characters from it, in our case square brackets. - It is necessary to reformat the table so that one line contains information about one goal achieved during the visit. Those. if three goals were achieved during one visit, then this visit will be divided into three rows, and each line, in the ym.s.goalsID column will contain the identifier of only one goal.
- Attach a table with a list of goals to the log table to understand exactly what goals were achieved during each visit.
- Rename the name column with goal names to events .
All of the above actions are implemented using the following code:
Postprocessing code for data received from the Logs API # logs_goals <- logs %>% mutate(ym.s.goalsID = str_replace_all(ym.s.goalsID, # "\\[|\\]", "") %>% str_split(",")) %>% # unnest(cols = c(ym.s.goalsID)) %>% mutate(ym.s.goalsID = as.integer(ym.s.goalsID)) %>% # id left_join(goals, by = c("ym.s.goalsID" = "id")) %>% # rename(events = name) # events
A small explanation of the code. The %>% operator is called a pipeline, and makes the code more readable and compact. In fact, it takes the result of executing one function and passes it as the first argument to the next function. Thus, a kind of conveyor is obtained, which allows you not to clog the RAM with superfluous variables that store intermediate results.
The str_replace_all function removes square brackets in the ym.s.goalsID column. str_split splits the target identifiers from the ym.s.goalsID column into separate values, and unnest splits them into separate rows, duplicating the values of all other columns.
Using mutate we cast target identifiers to integer type.
left_join goals table to the result, which stores information about the configured goals. Using the ym.s.goalsID column from the current table and the id column from the goals table as the key.
Finally, the rename function renames the name column to events .
Now the logs_goals table has the appearance necessary for further work.
Next, create three new tables:
- first_visits - dates of the first sessions for all new users
- cart - dates of adding products to the basket
- orders - orders
Table creation code # first_visits <- logs_goals %>% filter(ym.s.isNewUser == 1 ) %>% # select(ym.s.clientID, # clientID ym.s.date) # date # cart <- logs_goals %>% filter(events == " ") %>% select(ym.s.clientID, ym.s.date) # orders <- logs_goals %>% filter(events == " ") %>% select(ym.s.clientID, ym.s.date)
Each new table is the result of filtering the main logs_goals table obtained in the last step. Filtering is performed by the filter function.
To build funnels, it is enough for us to leave information about the user ID and the date of the event, which are stored in the ym.s.clientID and ym.s.date columns, in the new tables. The desired columns were selected using the select function.
Funnel types
The type argument accepts any combination of the values first , last , any and lastbefore with first , last , any and firstafter . The following is an example of the most useful combinations you can use:
first-first : get the earliest x and y events for each user. For example, we want to get the date of the first visit, and the date of the first purchase, in which case use the funnel type first-first .
# first-first first_visits %>% after_inner_join(orders, by_user = "ym.s.clientID", by_time = "ym.s.date", type = "first-first")
# A tibble: 42 x 3 ym.s.clientID ym.s.date.x ym.s.date.y <chr> <date> <date> 1 1552251706539589249 2019-04-18 2019-05-15 2 1554193975665391000 2019-04-02 2019-04-15 3 1554317571426012455 2019-04-03 2019-04-04 4 15544716161033564779 2019-04-05 2019-04-08 5 1554648729526295287 2019-04-07 2019-04-11 6 1554722099539384487 2019-04-08 2019-04-17 7 1554723388680198551 2019-04-08 2019-04-08 8 15547828551024398507 2019-04-09 2019-05-13 9 1554866701619747784 2019-04-10 2019-04-10 10 1554914125524519624 2019-04-10 2019-04-10 # ... with 32 more rows
We got a table in which 1 line contains data on the date of the user's first visit to the site, and the date of his first order.
first-firstafter : get the earliest x , then the first y happened after the first x . For example, a user has repeatedly visited your site, and during the course of visits he added products to the basket, if you need to get the date of adding the very first product to the basket, and the date of the order closest to it, use the first-firstafter funnel type.
cart %>% after_inner_join(orders, by_user = "ym.s.clientID", by_time = "ym.s.date", type = "first-firstafter")
# A tibble: 49 x 3 ym.s.clientID ym.s.date.x ym.s.date.y <chr> <date> <date> 1 1551433754595068897 2019-04-02 2019-04-05 2 1552251706539589249 2019-05-15 2019-05-15 3 1552997205196001429 2019-05-23 2019-05-23 4 1553261825377658768 2019-04-11 2019-04-11 5 1553541720631103579 2019-04-04 2019-04-05 6 1553761108775329787 2019-04-16 2019-04-16 7 1553828761648236553 2019-04-03 2019-04-03 8 1554193975665391000 2019-04-13 2019-04-15 9 1554317571426012455 2019-04-04 2019-04-04 10 15544716161033564779 2019-04-08 2019-04-08 # ... with 39 more rows
lastbefore-firstafter : first x followed by y before the next x . For example, a user has repeatedly visited your site, some of the sessions ended with a purchase. If you need to get the date of the last session before buying, and the date of purchase that followed, use the funnel type lastbefore-firstafter .
first_visits %>% after_inner_join(orders, by_user = "ym.s.clientID", by_time = "ym.s.date", type = "lastbefore-firstafter")
# A tibble: 50 x 3 ym.s.clientID ym.s.date.x ym.s.date.y <chr> <date> <date> 1 1551433754595068897 2019-04-05 2019-04-05 2 1552251706539589249 2019-05-15 2019-05-15 3 1552251706539589249 2019-05-16 2019-05-16 4 1552997205196001429 2019-05-23 2019-05-23 5 1553261825377658768 2019-04-11 2019-04-11 6 1553541720631103579 2019-04-05 2019-04-05 7 1553761108775329787 2019-04-16 2019-04-16 8 1553828761648236553 2019-04-03 2019-04-03 9 1554193975665391000 2019-04-15 2019-04-15 10 1554317571426012455 2019-04-04 2019-04-04 # ... with 40 more rows
In this case, we got a table in which one line contains the date the last product was added to the basket before each order was made, and the date of the order itself.
any-firstafter : get all x and the first y after it. For example, a user has repeatedly visited your site, during each visit, added various products to the basket and periodically made orders with all added products. If you need to get the dates of all additions of goods to the basket, and the dates of ordering, use the funnel type any-firstafter .
cart %>% after_inner_join(orders, by_user = "ym.s.clientID", by_time = "ym.s.date", type = "any-firstafter")
# A tibble: 239 x 3 ym.s.clientID ym.s.date.x ym.s.date.y <chr> <date> <date> 1 1551433754595068897 2019-04-02 2019-04-05 2 1551433754595068897 2019-04-02 2019-04-05 3 1551433754595068897 2019-04-03 2019-04-05 4 1551433754595068897 2019-04-03 2019-04-05 5 1551433754595068897 2019-04-03 2019-04-05 6 1551433754595068897 2019-04-05 2019-04-05 7 1551433754595068897 2019-04-05 2019-04-05 8 1551433754595068897 2019-04-05 2019-04-05 9 1551433754595068897 2019-04-05 2019-04-05 10 1551433754595068897 2019-04-05 2019-04-05 # ... with 229 more rows
- any-any: get all x and all y next to each x . For example, you want to get a list of all visits to the site with all subsequent orders made by each user.
first_visits %>% after_inner_join(orders, by_user = "ym.s.clientID", by_time = "ym.s.date", type = "any-any")
# A tibble: 122 x 3 ym.s.clientID ym.s.date.x ym.s.date.y <chr> <date> <date> 1 1552251706539589249 2019-04-18 2019-05-15 2 1552251706539589249 2019-04-18 2019-05-15 3 1552251706539589249 2019-04-18 2019-05-15 4 1552251706539589249 2019-04-18 2019-05-16 5 1554193975665391000 2019-04-02 2019-04-15 6 1554193975665391000 2019-04-02 2019-04-25 7 1554317571426012455 2019-04-03 2019-04-04 8 15544716161033564779 2019-04-05 2019-04-08 9 1554648729526295287 2019-04-07 2019-04-11 10 1554722099539384487 2019-04-08 2019-04-17 # ... with 112 more rows
Funnel steps
The above examples demonstrate working with the after_inner_join() function, it is convenient to use it in cases where you have all the events separated by separate tables, in our case according to the tables first_visits , cart and orders .
But the Logs API gives you information about all the events in one table, and the funnel_start() and funnel_step() functions will be a more convenient way to create a sequence of actions. funnel_start helps set the first step of the funnel and takes five arguments:
- tbl - Event table;
- moment_type - The first event in the funnel;
- moment - The name of the column that contains the name of the event;
- tstamp - Name of the column with the date the event occurred;
- user - The name of the column with user identifiers.
logs_goals %>% select(events, ym.s.clientID, ym.s.date) %>% funnel_start(moment_type = " ", moment = "events", tstamp = "ym.s.date", user = "ym.s.clientID")
# A tibble: 52 x 2 ym.s.clientID `ym.s.date_ ` <chr> <date> 1 1556018960123772801 2019-04-24 2 1561216372134023321 2019-06-22 3 1556955573636389438 2019-05-04 4 1559220890220134879 2019-05-30 5 1553261825377658768 2019-04-11 6 1561823182372545402 2019-06-29 7 1556047887455246275 2019-04-23 8 1554722099539384487 2019-04-17 9 1555420652241964245 2019-04-17 10 1553541720631103579 2019-04-05 # ... with 42 more rows
funnel_start returns a table with ym.s.clientI and ym.s.date_ column ym.s.date_ (the name of your column with the date, _ and the name of the event).
The following steps can be added using the funnel_step() function. In funnel_start we already specified the identifiers of all the required columns, now we need to specify which event will be the next step in the funnel, using the argument moment_type , and the connection type is type (for example, "first-first" , "first-any" ).
logs_goals %>% select(events, ym.s.clientID, ym.s.date) %>% funnel_start(moment_type = " ", moment = "events", tstamp = "ym.s.date", user = "ym.s.clientID") %>% funnel_step(moment_type = " ", type = "first-last")
# A tibble: 319 x 3 ym.s.clientID `ym.s.date_ ` `ym.s.date_ ` <chr> <date> <date> 1 1550828847886891355 2019-04-01 NA 2 1551901759770098825 2019-04-01 NA 3 1553595703262002507 2019-04-01 NA 4 1553856088331234886 2019-04-01 NA 5 1554044683888242311 2019-04-01 NA 6 1554095525459102609 2019-04-01 NA 7 1554100987632346537 2019-04-01 NA 8 1551433754595068897 2019-04-02 2019-04-05 9 1553627918798485452 2019-04-02 NA 10 155418104743178061 2019-04-02 NA # ... with 309 more rows
With funnel_step you can build funnels with any number of steps. To build a complete funnel for each user, in my example, you can use the following code:
Code for building a complete funnel for each user # # events - " " logs_goals <- logs_goals %>% filter(ym.s.isNewUser == 1 ) %>% mutate(events = " ") %>% bind_rows(logs_goals) # logs_goals %>% select(events, ym.s.clientID, ym.s.date) %>% funnel_start(moment_type = " ", moment = "events", tstamp = "ym.s.date", user = "ym.s.clientID") %>% funnel_step(moment_type = " ", type = "first-last") %>% funnel_step(moment_type = " ", type = "first-last") %>% funnel_step(moment_type = " ", type = "first-last")
And now the cherry on the cake is summarize_funnel() . A function that allows you to display the percentage of users who switched from the previous step to the next, and the percentage of users who have passed from the first step, to each subsequent one.
my_funnel <- logs_goals %>% select(events, ym.s.clientID, ym.s.date) %>% funnel_start(moment_type = " ", moment = "events", tstamp = "ym.s.date", user = "ym.s.clientID") %>% funnel_steps(moment_type = c(" ", " ", " "), type = "first-last") %>% summarize_funnel()
# A tibble: 4 x 4 moment_type nb_step pct_cumulative pct_step <fct> <dbl> <dbl> <dbl> 1 18637 1 NA 2 1589 0.0853 0.0853 3 689 0.0494 0.579 4 34 0.0370 0.749
nb_step — , , pct_cumulative — , pct_step — .
my_funnel , ggplot2 .
ggplot2 — R, . , , .
ggplot2 , 2005 . , photoshop, , .
# install.packages("ggplot2") library(ggplot2) my_funnel %>% mutate(padding = (sum(my_funnel$nb_step) - nb_step) / 2) %>% gather(key = "variable", value = "val", -moment_type) %>% filter(variable %in% c("nb_step", "padding")) %>% arrange(desc(variable)) %>% mutate(moment_type = factor(moment_type, levels = c(" ", " ", " ", " "))) %>% ggplot( aes(x = moment_type) ) + geom_bar(aes(y = val, fill = variable), stat='identity', position='stack') + scale_fill_manual(values = c('coral', NA) ) + geom_text(data = my_funnel, aes(y = sum(my_funnel$nb_step) / 2, label = paste(round(round(pct_cumulative * 100,2)), '%')), colour='tomato4', fontface = "bold") + coord_flip() + theme(legend.position = 'none') + labs(x='moment', y='volume')
:
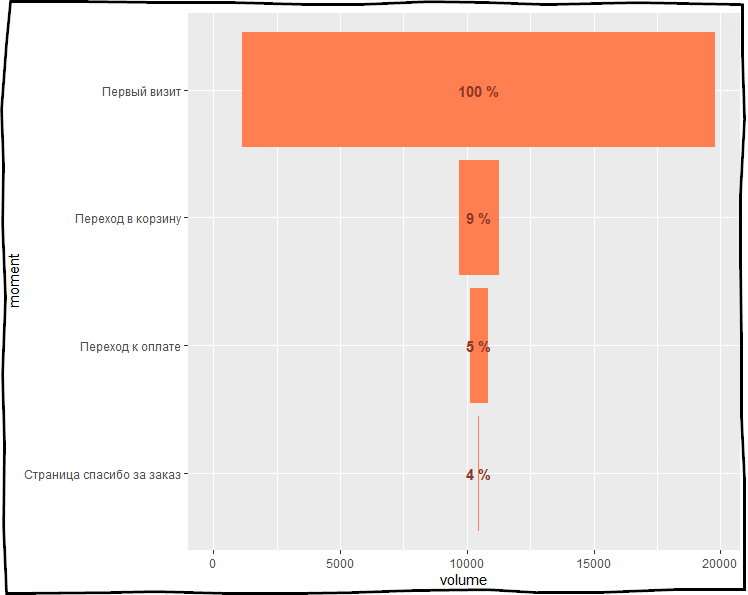
.
- my_funnel .
ggplot — , , , X moment_type .geom_bar — — , aes .scale_fill_manual — , , .geom_text — , % .coord_flip — , .theme — : , .. .labs — .
, , , , .
lapply , R. , , bind_rows .
# first_visits <- rename(first_visits, firstSource = ym.s.lastTrafficSource) # logs_goals <- select(first_visits, ym.s.clientID, firstSource) %>% left_join(logs_goals, ., by = "ym.s.clientID") # my_multi_funnel <- lapply(c("ad", "organic", "direct"), function(source) { logs_goals %>% filter(firstSource == source) %>% select(events, ym.s.clientID, ym.s.date) %>% funnel_start(moment_type = " ", moment = "events", tstamp = "ym.s.date", user = "ym.s.clientID") %>% funnel_steps(moment_type = c(" ", " ", " "), type = "first-last") %>% summarize_funnel() %>% mutate(firstSource = source) }) %>% bind_rows() #
# A tibble: 12 x 5 moment_type nb_step pct_cumulative pct_step firstSource <fct> <int> <dbl> <dbl> <chr> 1 14392 1 NA ad 2 154 0.0107 0.0107 ad 3 63 0.00438 0.409 ad 4 14 0.000973 0.222 ad 5 3372 1 NA organic 6 68 0.0202 0.0202 organic 7 37 0.0110 0.544 organic 8 13 0.00386 0.351 organic 9 607 1 NA direct 10 49 0.0807 0.0807 direct 11 21 0.0346 0.429 direct 12 8 0.0132 0.381 direct
my_multi_funnel , .
# my_multi_funnel %>% mutate(padding = ( 1 - pct_cumulative) / 2 ) %>% gather(key = "variable", value = "val", -moment_type, -firstSource) %>% filter(variable %in% c("pct_cumulative", "padding")) %>% arrange(desc(variable)) %>% mutate(moment_type = factor(moment_type, levels = c(" ", " ", " ", " ")), variable = factor(variable, levels = c("pct_cumulative", "padding"))) %>% ggplot( aes(x = moment_type) ) + geom_bar(aes(y = val, fill = variable), stat='identity', position='stack') + scale_fill_manual(values = c('coral', NA) ) + geom_text(data = my_multi_funnel_df, aes(y = 1 / 2, label =paste(round(round(pct_cumulative * 100, 2)), '%')), colour='tomato4', fontface = "bold") + coord_flip() + theme(legend.position = 'none') + labs(x='moment', y='volume') + facet_grid(. ~ firstSource)
:

?
first_visits ym.s.lastTrafficSource firstSource .left_join ym.s.clientID . firstSource .lapply ad, organic direct. bind_rows .facet_grid(. ~ firstSource) , firstSource .
PS
. PS , R. R4marketing , R .
:
Conclusion
, , R :
- .;
- R RStudio;
rym , funneljoin ggplot2 ;rym rym_get_logs() .;funneljoin .ggplot2 .
, Logs API , : CRM, 1 . , : , -.