In a
previous article, I talked about our large load test infrastructure. On average, we create about 100 servers to supply load and about 150 servers for our service. All these servers need to be created, deleted, configured and run. For this we use the same tools as on the prod to reduce the amount of manual work:
- To create and delete a test environment - Terraform scripts;
- To configure, update and run - Ansible scripts;
- For dynamic scaling depending on the load - self-written Python scripts.
Thanks to the Terraform and Ansible scripts, all operations from creating instances to starting the server are performed by just six commands:
# aws ansible-playbook deploy-config.yml # ansible-playbook start-application.yml # ansible-playbook update-test-scenario.yml --ask-vault-pass # Jmeter , infrastructure-aws-cluster/jmeter_clients:~# terraform apply # jmeter ansible-playbook start-jmeter-server-cluster.yml # jmeter ansible-playbook start-stress-test.yml #
Dynamic server scaling
At rush hour on production, we have more than 20K online users at the same time, and at other hours there may be 6K. It makes no sense to constantly keep the full volume of servers, so we set up auto-scaling for the board-servers, on which the boards open at the moment users enter them, and for API-servers that process API-requests. Now servers are created and deleted when necessary.
Such a mechanism is very effective in load testing: by default, we can have the minimum number of servers, and at the time of the test they will automatically rise in the right amount. At the beginning, we can have 4 board servers, and at the peak - up to 40. At the same time, new servers are not created immediately, but only after the current servers load. For example, a criterion for creating new instances may be 50% of CPU utilization. This allows you to not slow down the growth of virtual users in the script and not create unnecessary servers.
A bonus of this approach is that thanks to dynamic scaling we find out how much capacity we need for a different number of users, which we did not have on the sale yet.
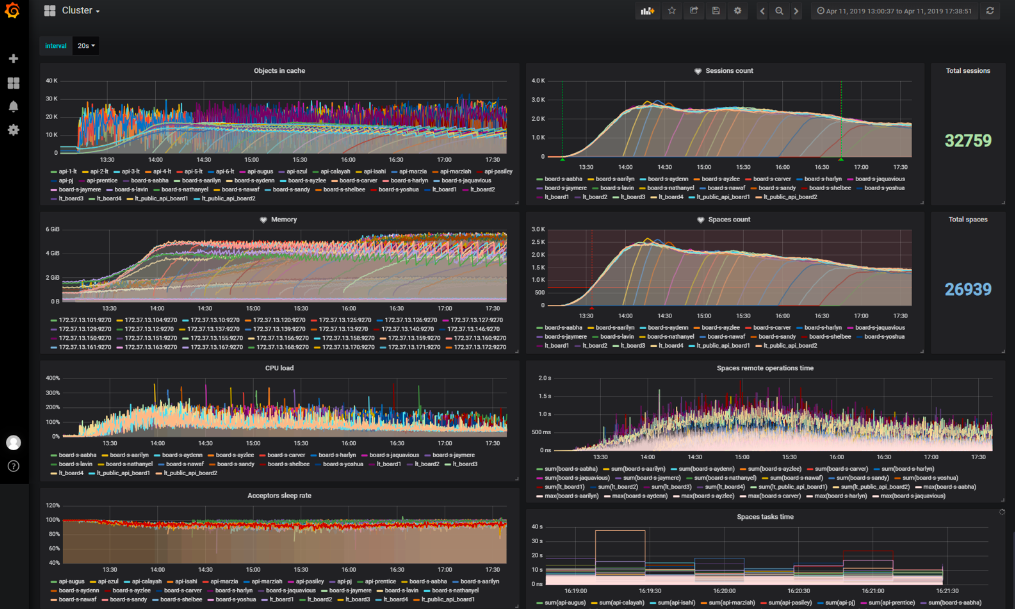
Collection of metrics as on prod
There are many approaches and tools for monitoring stress tests, but we went our own way.
We monitor production with a standard stack: Logstash, Elasticsearch, Kibana, Prometheus and Grafana. Our cluster for tests is similar to the product, so we decided to do the same monitoring as the prod, with the same metrics. There are two reasons for this:
- No need to build a monitoring system from scratch, we already have it complete and immediately;
- We additionally test the monitoring of sales: if during monitoring of the test we understand that we do not have enough data to analyze the problem, then it will not be enough for production, when such a problem appears there.

What we show in the reports
- Technical characteristics of the stand;
- The script itself, described in words, not code;
- A result that is understandable to all team members, both developers and managers;
- Graphs of the general state of the stand;
- Graphs that show a bottleneck or what is affected by the optimization checked in the test.
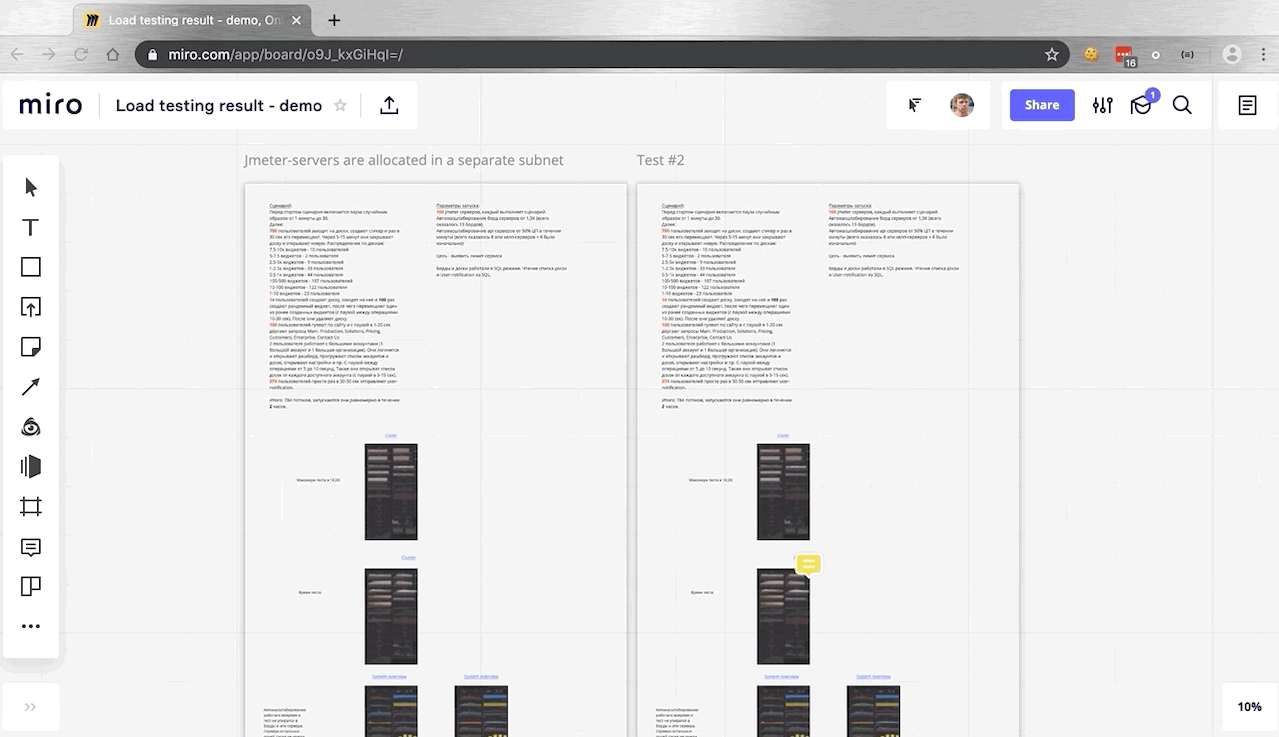
It is important that all results are stored in one place. So it will be convenient to compare them with each other from launch to launch.
We make reports in our product
(example of a whiteboard with a report) :

Creating a report takes a lot of time. Therefore, our plans are to make the collection of general information automatic using
our public API .
Infrastructure as code
We are responsible for the quality of the product is not QA Engineers, but the whole team. Stress tests are one of the quality assurance tools. Cool if the team understands that it is important to check under load the changes that it has made. To begin to think about it, she needs to become responsible for the production. Here we are helped by the principles of DevOps culture, which we began to implement in our work.
But starting to think about conducting stress tests is only the first step. The team will not be able to think through tests without understanding the production device. We encountered such a problem when we began to set up the process of conducting load tests in teams. At that time, the teams had no way to figure out the production device, so it was difficult for them to work on the design of the tests. There were several reasons: the lack of relevant documentation or one person who would have kept the whole picture of the sale in my head; multiple growth of the development team.
To help teams understand the work of sales, the Infrastructure approach can be a code that we began to use in the development team.
What problems we have already begun to solve using this approach:
- Everything must be scripted and can be raised at any time. This significantly reduces the recovery time for sales in the event of a data center accident and allows you to keep the right amount of relevant test environments;
- Reasonable savings: we deploy environments on Openstack when it can replace expensive platforms like AWS;
- Teams themselves create stress tests because they understand the device is selling;
- The code replaces the documentation, so there is no need to update it endlessly, it is always complete and up to date;
- You do not need a separate expert in a narrow field to solve ordinary problems. Any engineer can figure out the code;
- With a clear sales structure, it is much easier to schedule research load tests like chaos monkey testing or long memory leak tests.
I would like to extend this approach not only to the creation of infrastructure, but also to support various tools. For example, the database test, which I
talked about in a previous article , we completely turned into code. Due to this, instead of a pre-prepared site, we have a set of scripts, with which in 7 minutes we get the configured environment in a completely empty AWS account and can start the test. For the same reason, we are now carefully considering
Gatling , which the creators are positioning as a tool for “Load test as code”.
The approach to the infrastructure as a code entails a similar approach to testing it and the scripts that the team writes to raise the infrastructure of new features. All this should be covered by tests. There are also various test frameworks, such as
Molecule . There are tools for chaos monkey testing, for AWS there are paid tools, for Docker there are
Pumba , etc. They allow you to solve different types of tasks:
- How to check if one of the instances in AWS crashes to check if the load on the remaining servers is rebalanced and if the service will survive from such a sharp request redirection;
- How to simulate the slow operation of the network, its breakage and other technical problems, after which the logic of the service infrastructure should not break.
The solution of such problems in our immediate plans.
findings
- It’s not worth wasting time on manual orchestration of the test infrastructure , it’s better to automate these actions in order to more reliably manage all environments, including prod;
- Dynamic scaling significantly reduces the cost of maintaining sales and a large test environment, and also reduces the human factor when scaling;
- You can not use a separate monitoring system for tests, but take it from the market;
- It is important that stress test reports are automatically collected in a single place and have a uniform view. This will allow them to easily compare and analyze changes;
- Stress tests will become a process in the company when teams feel responsible for the sales;
- Load tests - infrastructure tests. If the load test was successful, it is possible that it was not compiled correctly. To validate the correctness of the test requires a deep understanding of the sales. Teams should be able to independently understand the sales work structure. We solve this problem using the Infrastructure as a Code approach;
- Infrastructure preparation scripts also require testing like any other code.