Google
recently released in public access a new version of Google Analytics called
App + Web . Simo Ahab has already written an excellent step-by-step instruction on how to start working with the tool, so I decided to translate it into Russian. On my own, I’ll add that the product has just appeared in beta and, apparently, it will still be substantially completed. We have already begun testing the new data structure and the capabilities of the built-in data export function in Google BigQuery and hope to soon tell you more about the advantages and disadvantages. In general, analysts today evaluate innovations positively. For example, Vlad Flax from OWOX BI believes that with this update, Google has simplified the process of collecting data and delivering it from Google Analytics to BigQuery for those projects that are ready to change the structure of their data. In addition, it adds value to Google BigQuery as a DWH for marketing data.
Below is a translation of an article by Simo with his ratings and impressions of use.
Despite the awkward title, it is really a great tool for all the goals and objectives of Google Analytics V2 or Firebase Analytics for Web. Here we are not talking about a charming way to create summary reports between
Google Analytics for Firebase and Universal Analytics, or about improving Universal Analytics.
No, we’re talking about a new web traffic measurement model that works well with Google Analytics for Firebase.
This is still a slightly unpolished product, and the documentation is still a little lacking, so I thought that I would give you an edge and show how to set up data collection using
Google Tag Manager . I intend to release a complete, proper, comprehensive guide as soon as the function leaves beta testing. However, this article should help those of you who are already eager to try out all of its new features and interesting things right now.
The name Google Analytics: App + Web is somewhat awkward. It seems to me that this is just a matter of time, when will we call it Firebase for the Web or something like that, because this is what it is in essence. In this article, I will call it GAv2 in those places where I will simply be reluctant to type the name in full (yes, I'm lazy).

Before you start, open Krista Seyden’s
wonderful blog in a new tab and pay special attention to the three articles she has published about Google Analytics reporting capabilities: App + Web.
- New App + Web Properties in Google Analytics
- Pathing in google analytics
- Streamview in Google Analytics .
UPDATE: Immediately after I published this article, Krista released another great guide, and the great thing is that it complements this because it covers in much more detail the steps involved in creating a Firebase project. In general, check out this: Step-by-step setup of App + Web .I'll start with a couple of opening words, so if you want, just skip them and go straight to the implementation steps.
Warnings
First of all, Google Analytics: App + Web is in
beta testing. This means that it is not yet fully prepared. Seriously, it's not ready yet. Many of the things that I’m racking my brains about now will undoubtedly fall on the platform at some point, as well as the answers to many questions that you will have, most likely will be given in future releases.
Here are some points that I found in the reporting UI and in the settings of Google Tag Manager:
- No specialized reports, such as Site Search Report or Ecommerce
- There is no way to distinguish between automatically collected, recommended, and custom events in the user reporting UI.
- You can configure the user resource, see below how to do it.
- It is not possible to send items an array (or any other multidimensional object) as an event parameter in Google Analytics when using GTM.
- Setting constant values in the configuration tag in GTM seems to be impossible.
- You can upgrade existing Firebase Analytics resources in accordance with this support document . When you open a resource in Google Analytics (provided that you have linked this resource in Google Analytics), you will see a blue banner at the top of the screen asking you to update.
Be sure to follow the
official blog , as well as Krista's
blog , because they will become your magic wand for more information, including issues devoted to the problems listed in this chapter.

And finally, the obvious point.
This is not Universal Analytics . Many of the things you're used to seeing in Universal Analytics aren't in Firebase. Personally, I hope that the parity of functionality is just around the corner, because now Google has a chance to create something new and better. But, of course, we all would like this platform to replace Universal Analytics at some point, therefore, it should be useful in at least the same use cases.
Here, in my opinion, the main differences between Universal Analytics and the new platform.
Universal Analytics:Everything is built around the concept of a session
Custom definitions for hit-, session-, and user-scoped.
Real-time surface reports.
Segments.
No semantic structuring.
Quite favorable quotas and limits (except for the sample).
Google Analytics V2:Everything is built around the concepts of "user" and "event"
Custom properties and custom event parameters
StreamView and DebugView provide more in-depth detail.
Lecture hall.
Automatically collected and recommended events.
Strict
quotas and restrictions (without sampling).
Limitations are especially painful when compared to what Universal Analytics did.
In any case, I’m sure that these problems will be resolved before Google Analytics: App + Web comes out of beta testing, but one thing is certain:
this is not Universal Analytics . Try looking at the new measurement model as an opportunity to go beyond what Universal Analytics could ever offer, and not just as a way to populate the ancient GA data model.
Due to these warnings,
I strongly recommend that you stop collecting data in Universal Analytics and collect data exclusively in Google Analytics: App + Web . In any case, it is better to run this new measurement model in parallel with any setting that was already on the site so that you can compare the parity between the two data sets.
Creating New Analytics Settings: App + Web
To create a new Google Analytics property: App + Web, you need to do the following:
Note! Based on the published documentation, it is likely that these steps will be greatly simplified in the future.
Step 1: Create a New Firebase Project
Go to
the Firebase console and create a new project. This will be the base Firebase project for your new setup.
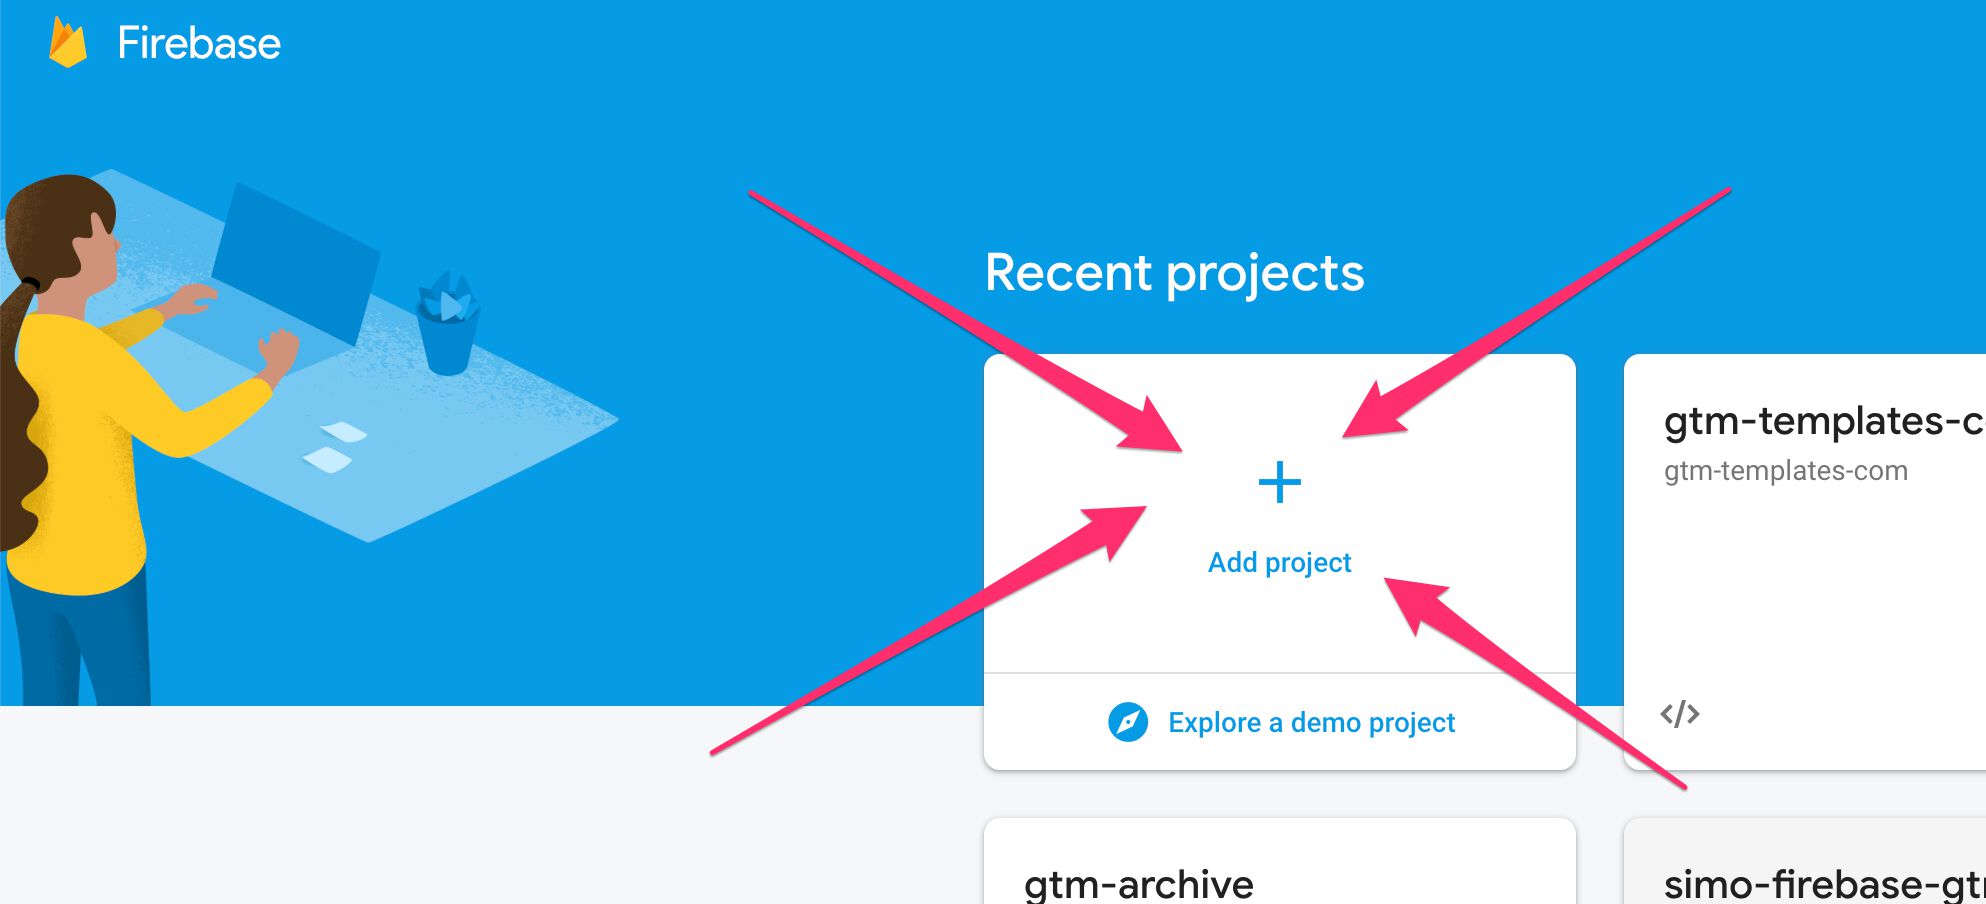
Give the project a name and ID (the ID must be unique, it will be generated based on the name of the project).
Read and accept the Firebase terms, then click Continue.

In the next step, make sure the “Set up Google Analytics for my project” checkbox is selected, and click Continue.

Depending on whether you already have Google accounts or not, now you can choose in which account to create the resource or create a new account as a whole. If you do not have Google Analytics accounts associated with your login, you will need to accept the GA terms of service, after which a new account and resource will be created for you.
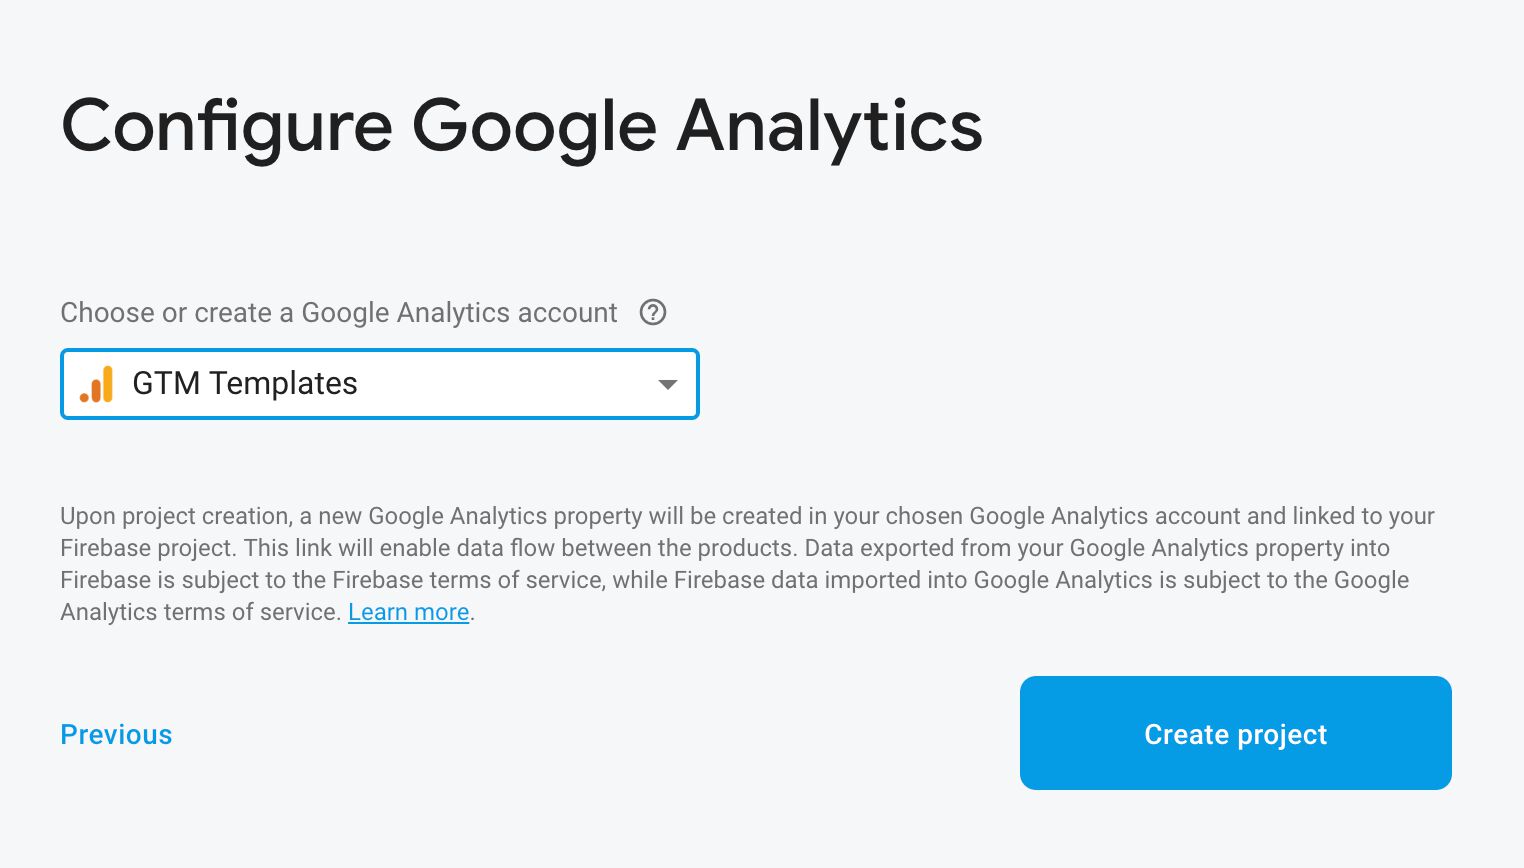
After you click
Create project and the processing is completed, you can go to Google Analytics and find the new App + Web resource in your chosen account.
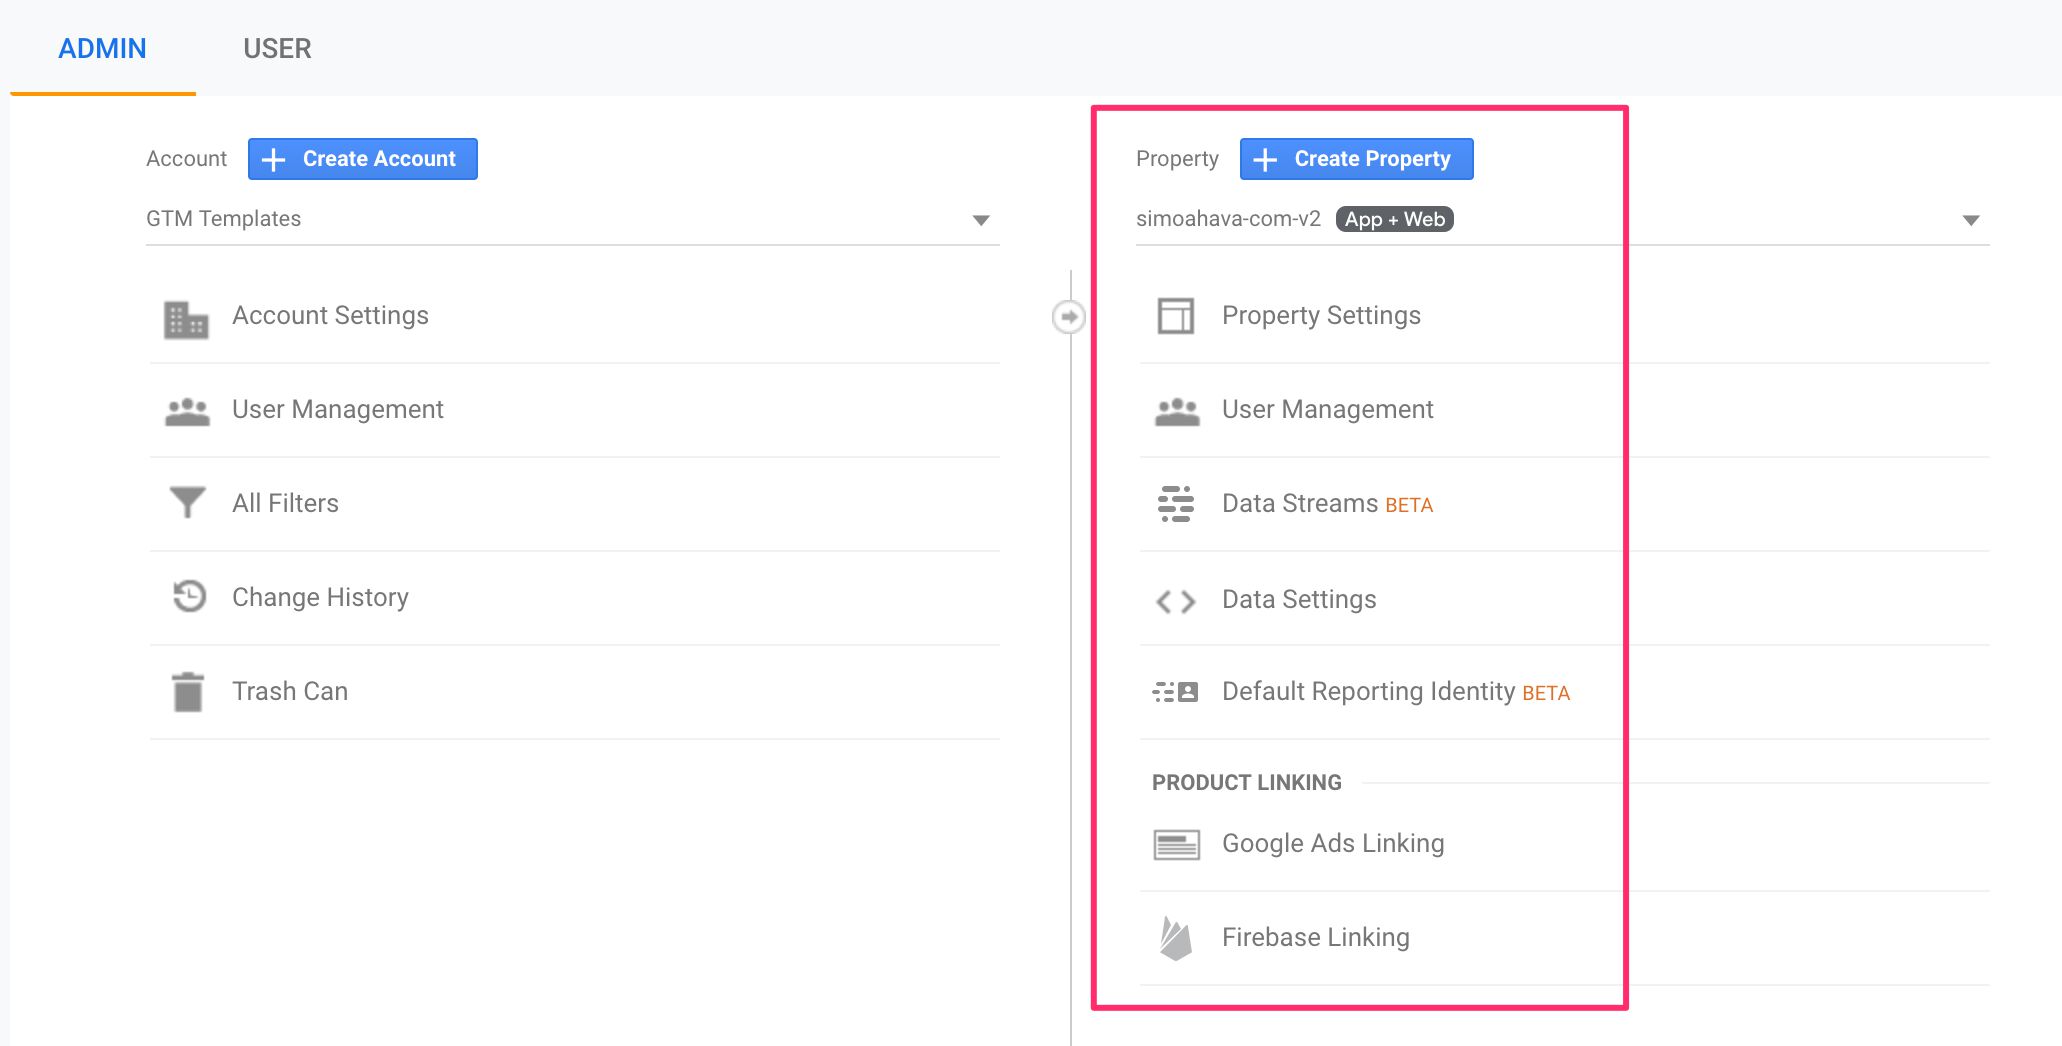
Step 2. Create a new web stream
The new measurement model revolves around
streams that can come from your applications (iOS and Android) or from the Internet. I hope that in the future we will see new streams, such as the Measurement Protocol, which will accept HTTP requests from any device connected to the Internet.
In either case, select the
Data Streams option in the resource column and select
Web .

To set up a stream, enter the URL of your site and give the stream a descriptive name. Then click on the small gear to set up the Enhanced Measurement.

Enhanced Measurement basically adds some automatic tracking features to the site that are activated when the
basic configuration tag is created.

The list of things that can be automatically tracked is pretty clear and well explained in the Enhanced Measurement configuration (see screenshot above).
Once you are ready, create a data stream and you will see a bunch of tagging instructions and other points on the screen. The most important thing to note is the Measurement ID. Keep this tab open so that you can copy dimension IDs into Google Tag Manager tags if necessary.

Are you done? Ok, now let's move on to the Google Tag Manager.
Create a basic configuration tag
In Google Tag Manager, when you create a new tag, you will see two new tag templates in the selector.
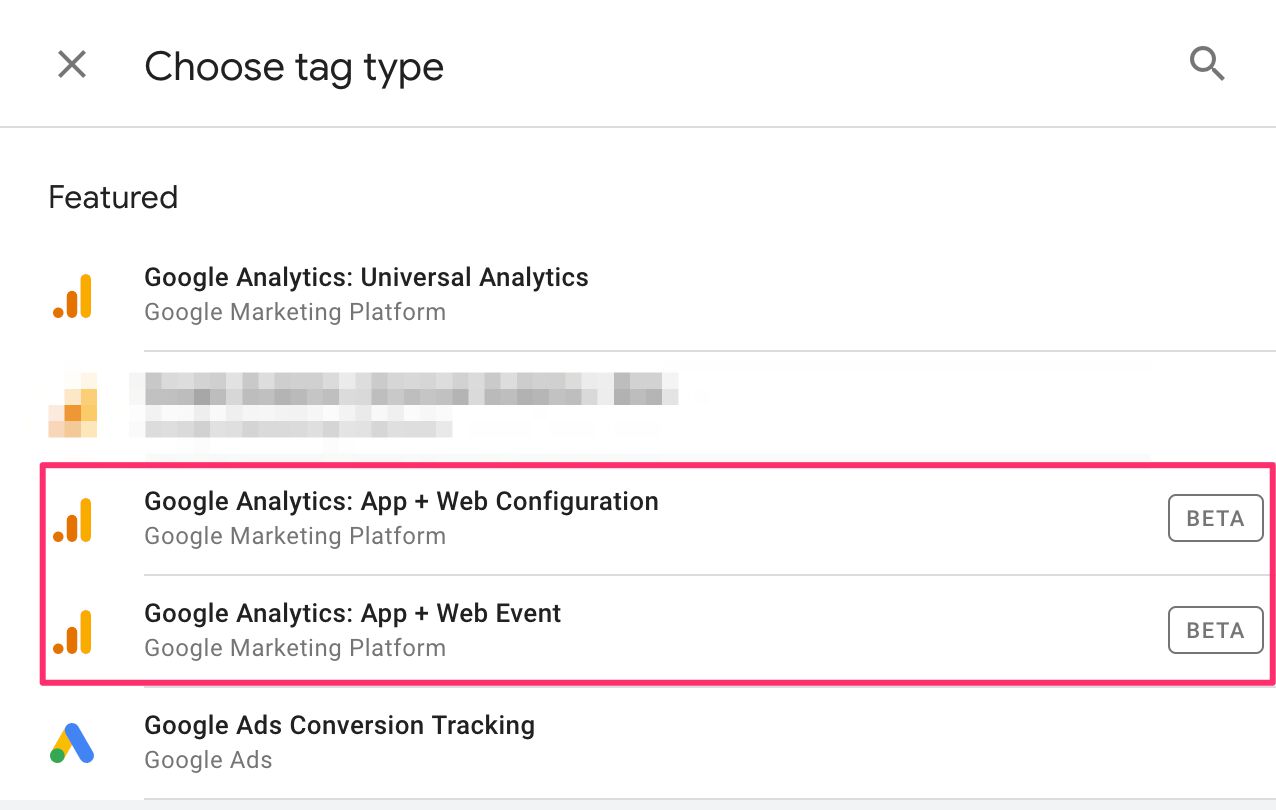
Google Analytics: App + Web Configuration is similar
to the config command used in the
gtag.js implementation. You use it to configure the tracker, send an initial pageview, and set constant values for all your events.
When you open the template, you certainly are not welcomed by a lot of options. In fact, you have a field for determining the Measurement ID, a
switch for choosing whether to send the initial pageview or not, and
configuration fields that you can set in the tag.

To configure the base tag, specify it in the Measurement ID field from the web stream created in the previous part. You can set a value in the
user_id field that is associated with the user authentication ID in case you want to pave the way for measurement between devices and applications.
According to the
documentation , you should be able to define any event parameters in the Fields to set of the configuration tag if you want these event parameters to be sent on every subsequent call that uses the same dimension ID. Unfortunately, at the time of writing, this does not seem to work.
Set custom properties
To set user properties, you must first
create them in the reporting UI.
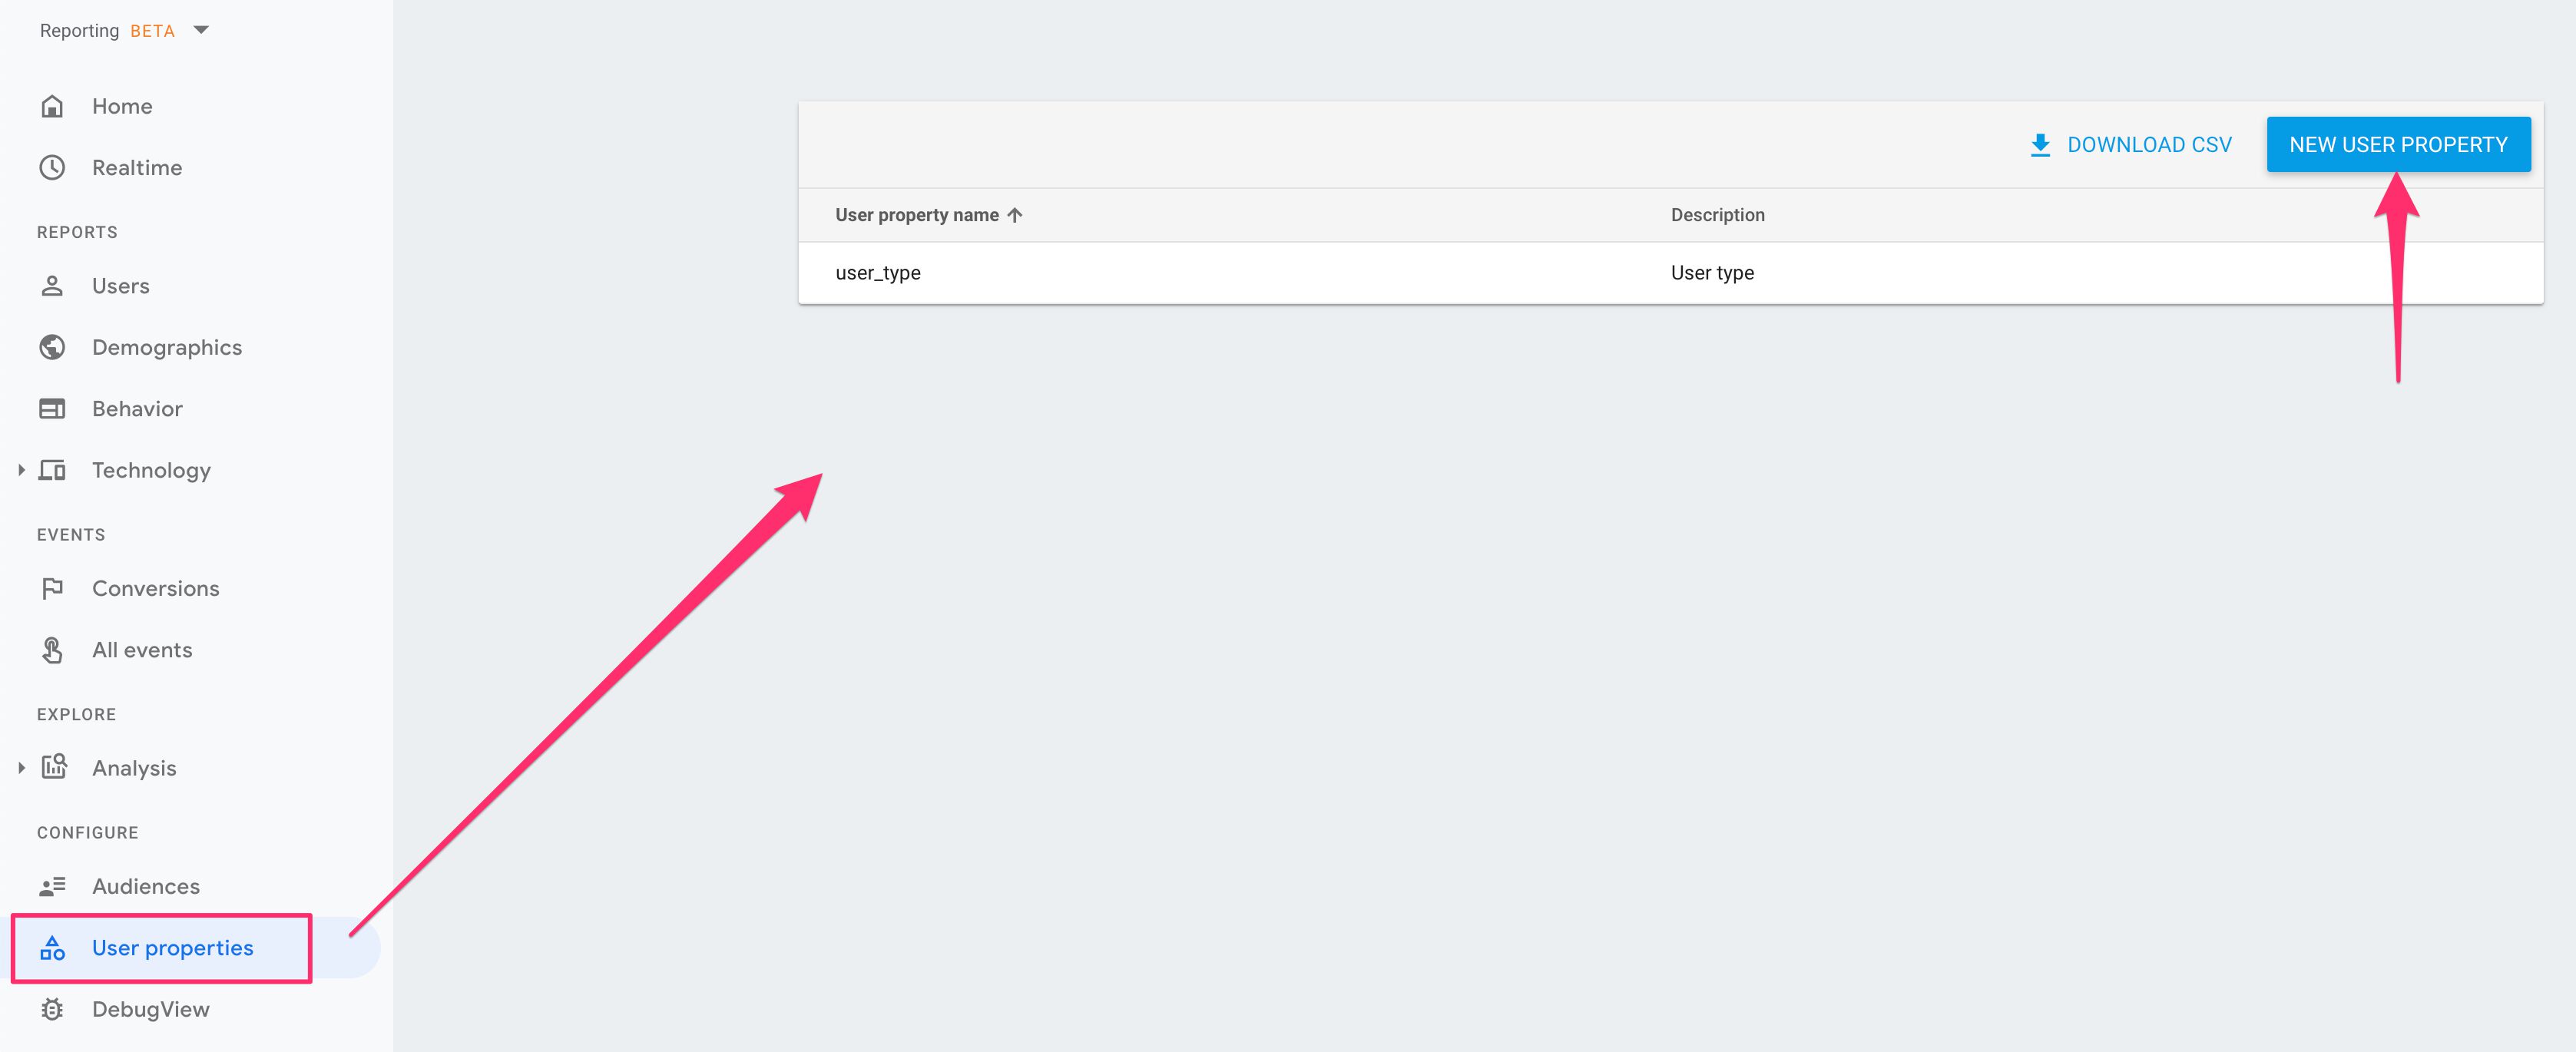
Next, go to your configuration in Fields to Set and add a new field. The field name must be
user_properties .

You must use a custom JavaScript variable (or a custom variable template) as the field value, which returns an object where each key of the object corresponds to the User Property name that you created in the reporting UI, and the value is the same as what you want to send as a custom property in question.
For example, to set the
user_type property (see screenshot above), I can create a Custom JavaScript variable that looks like this:
"function() { return { user_type: 'Premium user' }; }"
Then you need to add this variable as the value of the
user_properties field in the configuration tag.
An alternative method is to use a custom variable template (see my
guide if you do not remember what user templates are).
Here is the template I created to return the user properties object. You can use it to create a variable in which you set individual keys and user property values, and then set this variable as the value of the
user_properties key in the configuration tag.
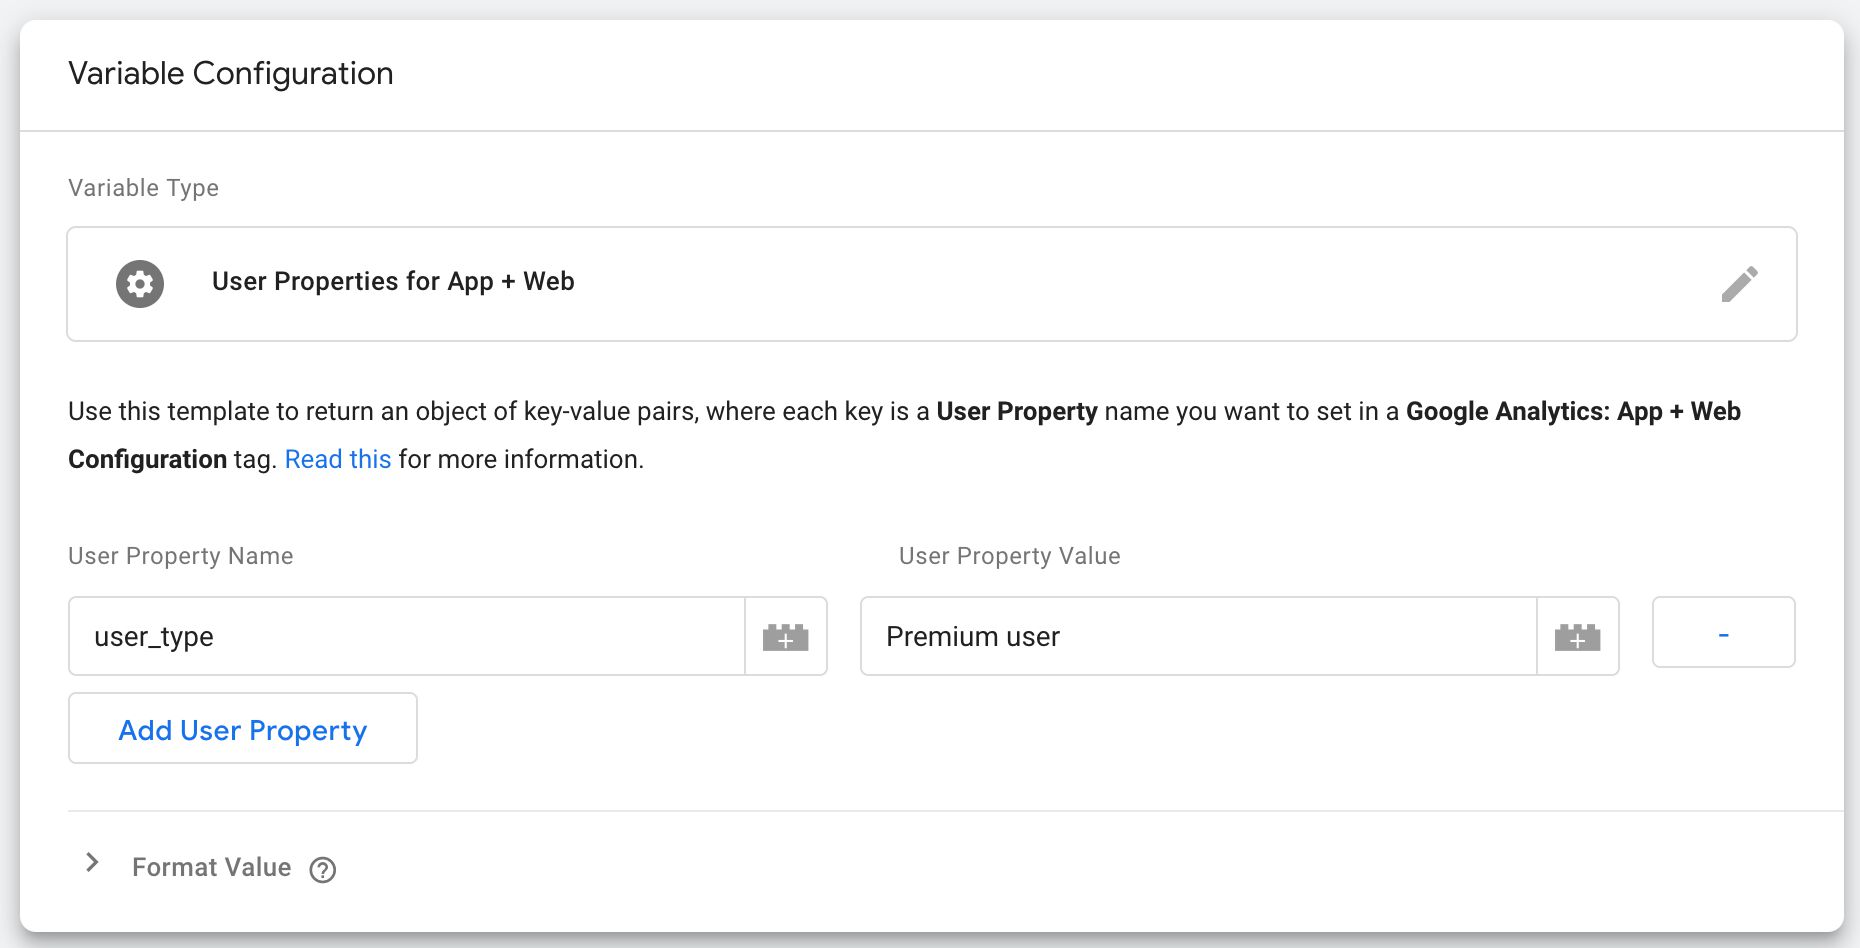
After you have created the configuration tag, enable it with the All pages switch and enter the preview mode. Let's see how this new measurement model works on a website!
Testing!
When you visit the site and download the preview container, open your browser’s
developer tools and look at the cookies used by GAv2.

The
cookie _ga almost the same as Universal Analytics, with one slight difference. The _ga cookie encodes the number of parts of the domain in the cookie value as the number after
GA1 . For example, if a cookie is written to simoahava.com, the domain consists of two parts, and the cookie prefix is GA1.2.
However, with GAv2, this is not like using the default
cookie_domain value (automatic configuration).
I think this may be an omission, as if you manually set the domain, for example,
www.simoahava.com , the cookie has the usual GA1.3. prefix.
Another
cookie, _ga_MEASUREMENT-ID ** , seems to support session state. The first long number is the timestamp (in seconds) when the cookie was created, and the second longest number is the timestamp when the last time a hit was sent to GA.
In other words, it seems that GAv2 at least keeps track of whether the session is currently active. It remains to be seen whether it will use client-side persistence to a greater extent for session information and whether this cookie can be used to determine session state in a web browser.
JavaScript is used for cookies, so they are affected by measures to reduce the performance of cookies on the client side, such as Safari's Intelligent Tracking Prevention.
Then, follow the web requests sent by the browser, or use the Google Analytics debugger extension to see how the library sends hits to Google Analytics.

First of all, you can see that the request is being sent to the familiar endpoint,
/collect , except that it is on the / g / path instead.
The request type is POST, and the endpoint is still an image pixel. In other words, the hit seems to use the Beacon API by default, which is a great improvement for Universal Analytics, where you had to manually enable this feature.
The Beacon API protects asynchronous requests sent when the page is unloaded, which allows them to be executed even if the browser is closed. This avoids the hassle of skipping calls (for example, events associated with a click on a link), because the user left the page before the request was completed.

If you look at the actual parameters sent to GA, there are many familiar things here, if you remember how the queries of the measurement protocol are built.
The parameter
v has a value of 2, whereas in Universal Analytics it is 1. This is the protocol version.
The
tid parameter is set to your dimension ID.
The
gtm parameter
gtm hashed from the ID of your GTM container.
The
cid parameter is the client identifier that is stored in the
cookie _ga .
Other options that have remained virtually unchanged include things like
uid (user ID), dl / dr / dt (document metadata), and
sr (screen resolution).
There is no longer a Hit Type dimension, instead the en (event name) parameter is used to distinguish different types of hits from each other. This is the main difference from Universal Analytics, because in GAv2 you have one single stream of events where the event parameters that you send along with the name of the event determine how the data is displayed in the reports.
Event parameters are prefixed with ep. or epn. for text parameters and numeric parameters, respectively. In the screenshot, I created an event parameter named country and set it to US.
User properties are prefixed with up. or upn. for custom properties in text or number format, respectively. The screenshot shows one text property of the user named
user_type , which is set to Premium user.
Finally, the sid parameter seems to contain the timestamp when the current session started (taken from
cookie _ga_MEASUREMENT-ID ).
It is still unclear what the other options are doing.
One thing you might notice is the delay in sending the hit. When you load the page, you can see how the browser waits a few seconds before sending the hit to GA. This is because GAv2 automatically groups requests, which, again, is a great feature update.
By bundling multiple hits into a single request, browser resources are saved for other purposes. The delay is due to the browser waiting for other hits to be sent along with the pageview.
Before creating your first event tag, see how Enhanced Measurement works. First, scroll down to the end of the current page and take a look at the event sent to Google Analytics.

Then click on the link that leads from your site (use CTRL / CMD + click to open it in a new tab). Take a look at the options.
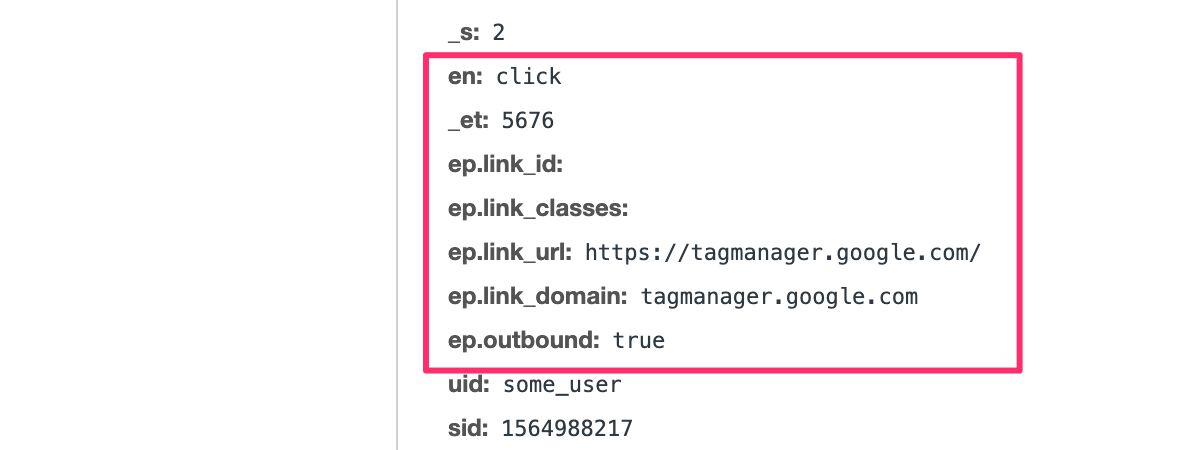
Finally, if YouTube is embedded on your site with enablejsapi = 1, check automatic video tracking!

It's all incredibly cool, but I hope we get some more controls to tweak the Enhanced Measurement.
Now, let's create our own event tag!
Create an event tag
function similarly to using gtag.js and Firebase events.
In other words, there is a combination of automatically collected events, recommended events, and user events.
When creating new events, first ensure that the event has not yet been automatically collected.
Then check to see if there is a recommended event structure that you can use instead of a custom event. If you find the appropriate recommended event, make sure you use the suggested event name and parameters when setting up the event tag.
Now, if you wish, you can still send a fully configured event name with completely arbitrary event parameters. Just keep in mind that you will lose some flexibility in the reporting user interface, as there are some strict restrictions on the number of custom properties that you can define for reporting in the user interface.
Let's start with a
simple custom event .
Create a new Google Analytics: App + Web Event teg and populate it as follows:

Set the Configuration Tag to the value created in the previous section. This works similarly to the Google Analytics settings variable, since you need to configure the tracker settings only once, after which they will be applied to all tags that use the configuration tag.
Give the event an arbitrary name (that is, not one of the automatically collected or recommended events). In this case, we use
data_loaded as the name of the event.
Then add some parameters:
all_data is a custom text parameter that is set to true.debug_mode is a parameter that, when installed in a tag, displays a hit in the DebugView UI stream of reporting (more about this below).
Check the box to launch the Window Loaded radio button, update the preview mode and upload the container to the website. Look at the network requests to
/collect .
After loading the page, you should see one request with two hits combined into one (batch mode).
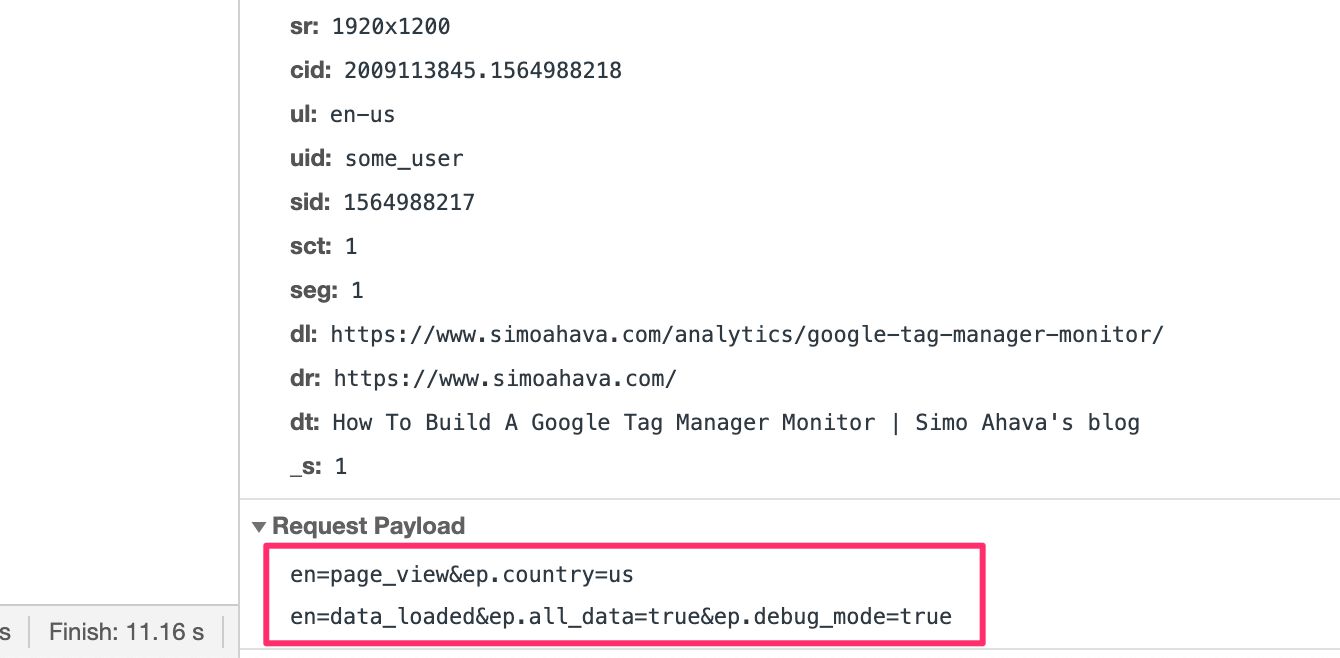
As you can see, in the first row there is a hit
page_view , and in the second row the user event
data_loaded .
Now go to the Google Analytics reporting UI and select DebugView in the report navigator.
Be sure to read Krista's excellent streaming reporting article to understand how to interpret the following data. You can also read Firebase DebugView's own documentation for more information.
In the Debug Device selector at the top of the screen, you can see how many devices (for example, browser instances) are currently sending debug hits to GA. Use the selector to scroll through the listed devices until you find the device that recently sent the
data_loaded event.
This Debug Devices selector is currently unusable. Hopefully in the near future it will be easier to find debug devices.Having found the
data_loaded event, you can see other hits included in DebugView. This is because if the package contained other hits other than the
data_loaded hit, they will also be automatically listed in DebugView.

You can click on the parameters in the
data_loaded event to see what type of information is sent to Google Analytics with a hit.
Before we finish, let's try sending a
recommended event too . We will send a search event to simulate a site search.
If you read the instructions in the
list of recommended events , you will see that the name of the search event is search, and it takes one parameter:
search_term . So, let's create a new event tag and fill in these values! Here's what the tag will look like:
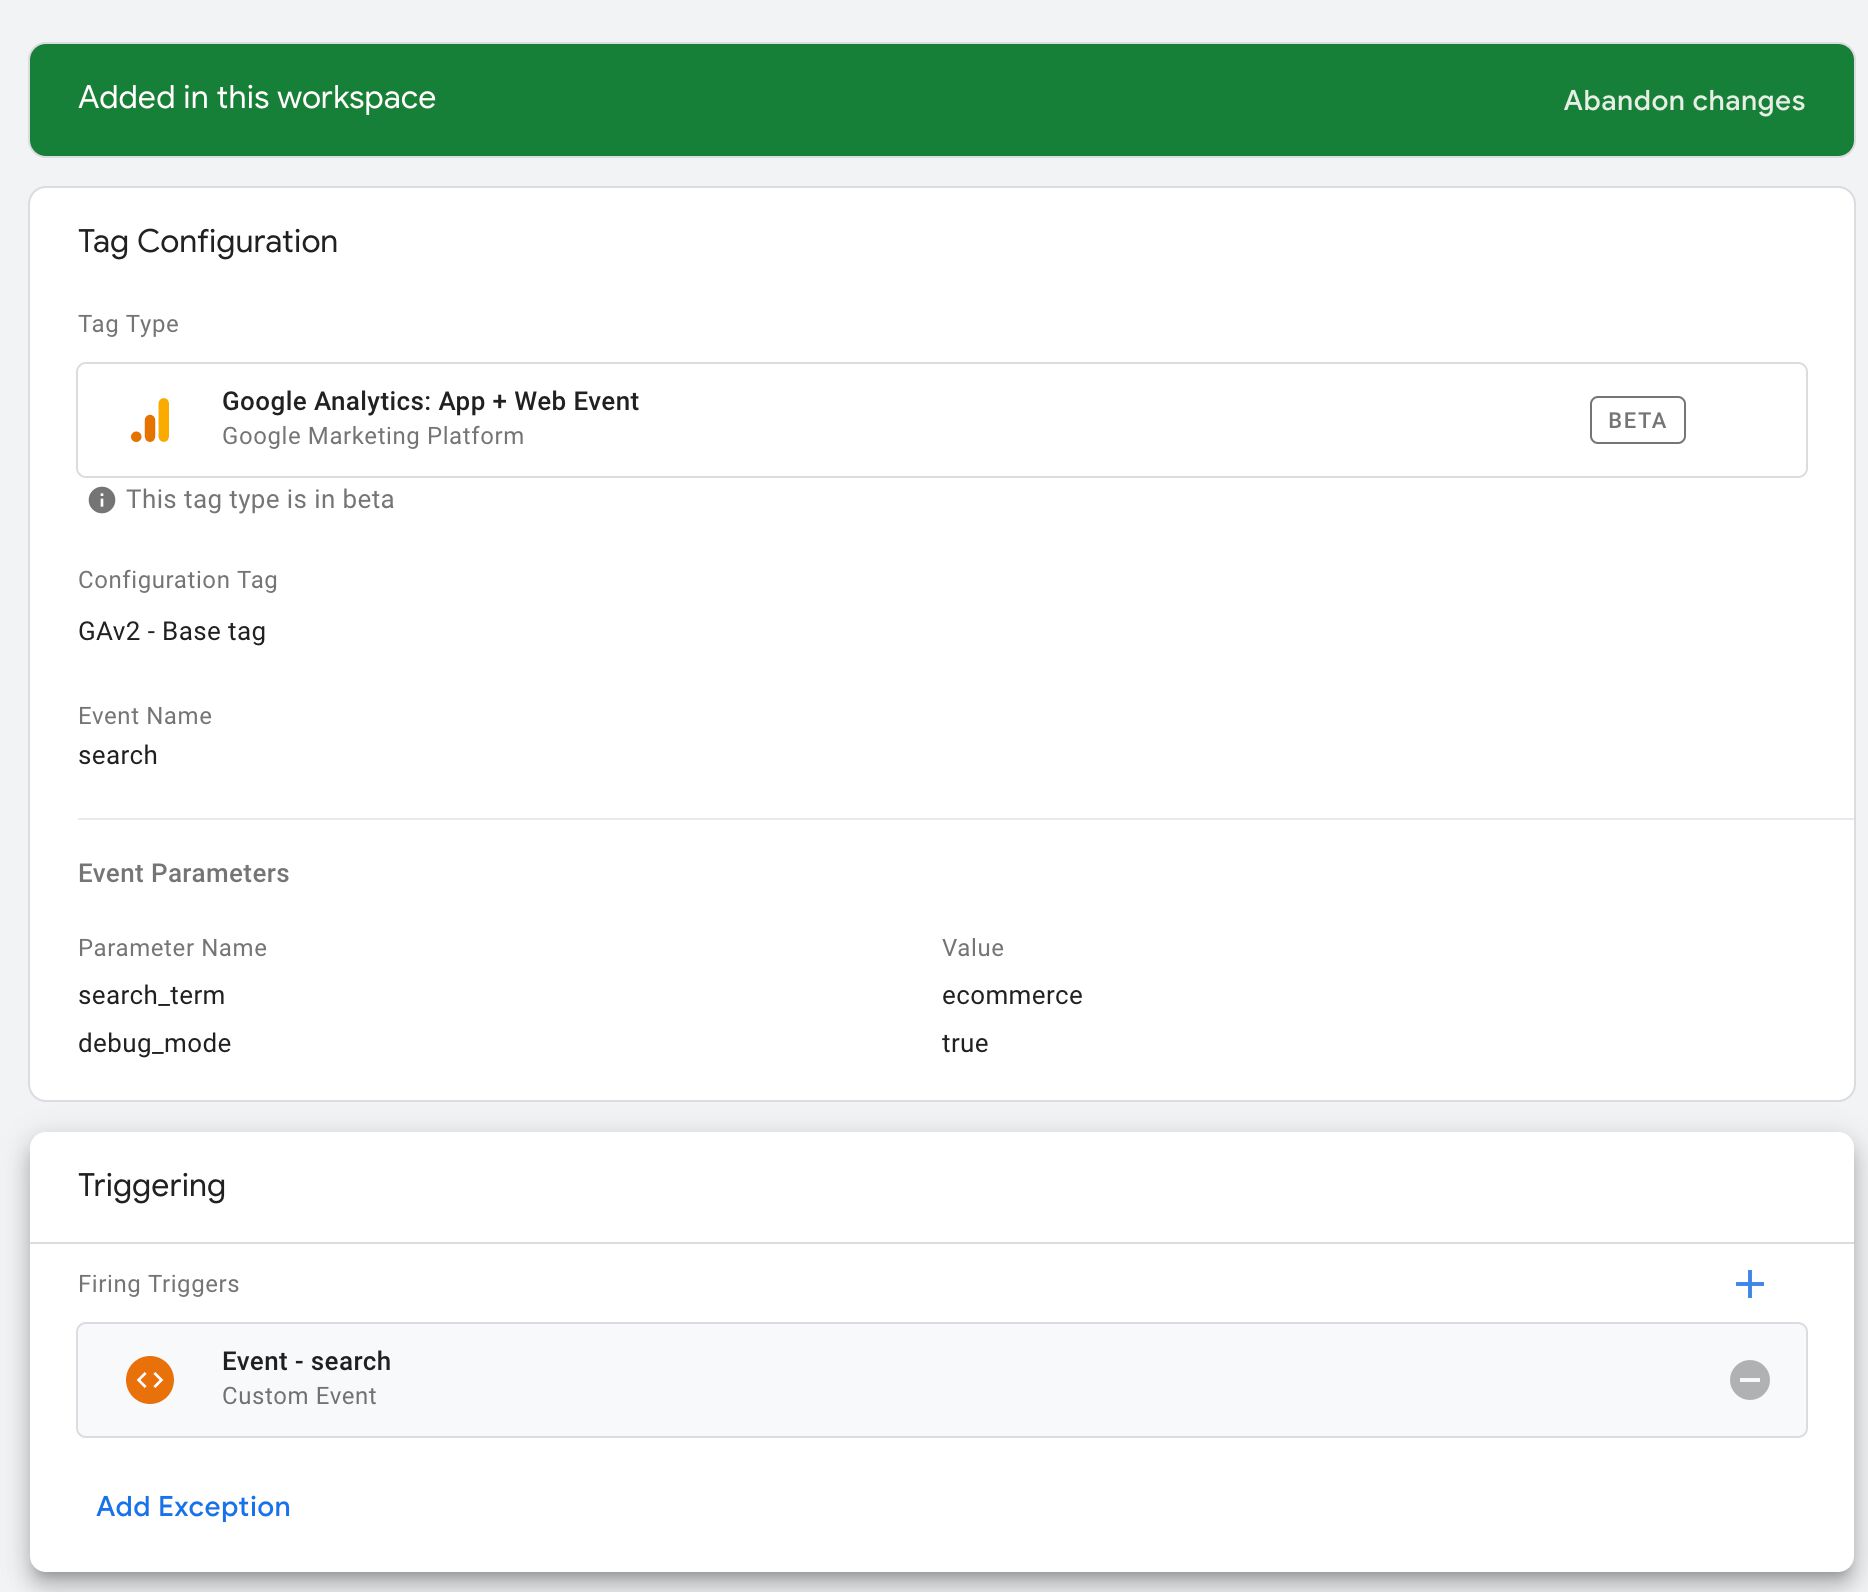
As you can see, I just hardcoded the search word in the event parameters. I am running a tag with a
Custom Event Trigger set to an event named
search .
After updating the preview mode and reloading my website, I can fire the event using a simple
window.dataLayer.push ({event: 'search'}) that runs in the page's JavaScript console.
In DebugView, I see that the event was logged:
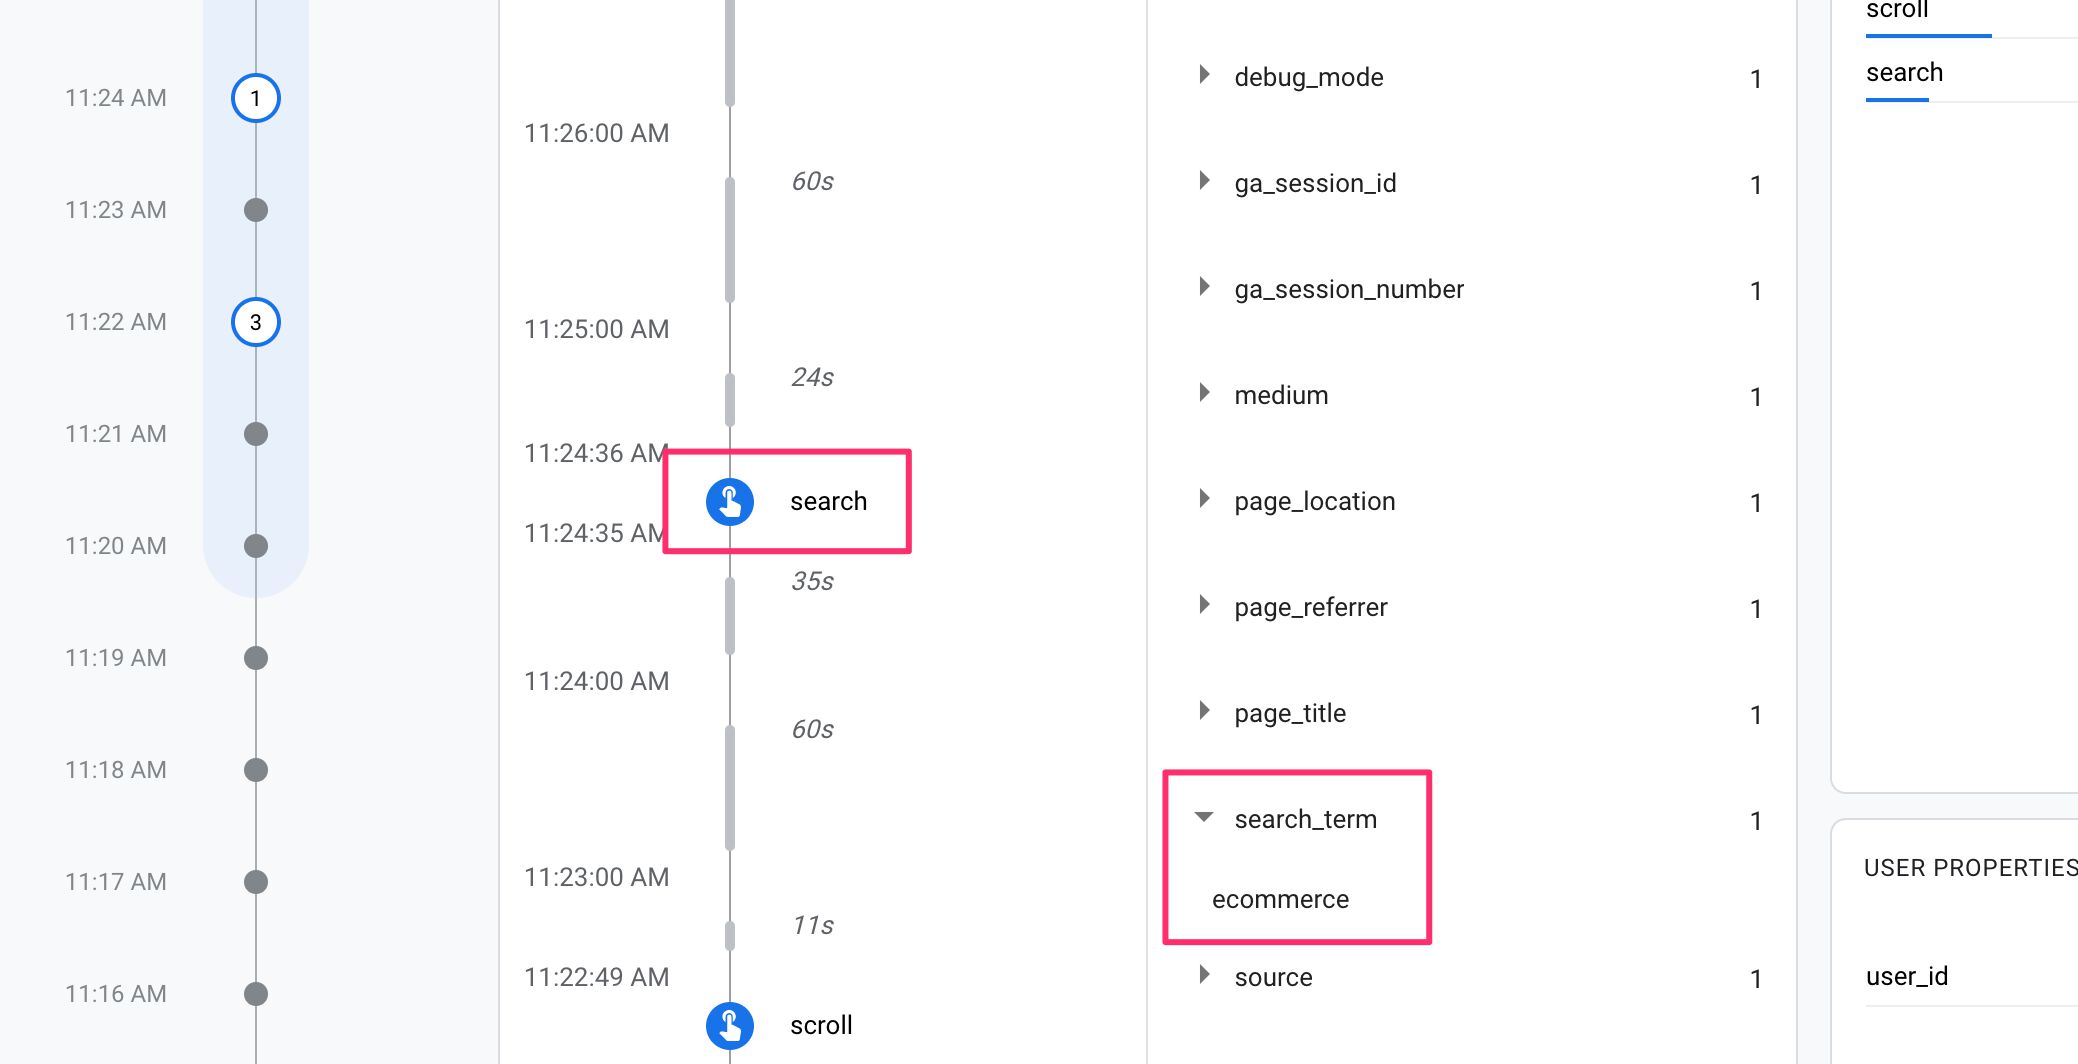
And ... that’s all. Nothing distinguishes this event from user events. There are no reports that match site search data similar to Universal Analytics. At some point, I’m sure that some search events will be recorded in their own report, where the search data is combined with the automatically collected event
view_search_results (page view recorded with query parameters corresponding to the search on the site).
Summary
In this article, I wanted to show you how to set up a new Google Analytics resource: App + Web when using Google Tag Manager as the chosen implementation tool.
Hopefully, I made it clear that this feature is still in
beta testing and thus is intentionally not completed. New features will be introduced over time, until in the future we exit the beta version with a fully functional platform.
Is this platform intended to replace Universal Analytics? Not known yet. But it would be conceptually difficult to justify future releases of the service or functions of Universal Analytics, when there is a new brilliant measurement model that you have to put up with.
I am pleased to cautiously introduce Firebase on the Internet. This is what I have been looking forward to since I started working with Firebase (and Firebase Analytics) a very long time ago. I think that the user and event measurement model is superior to the highly aggregated and session model used by Google Analytics.
However, it remains to be seen how much of the context switching we need to perform mentally in order to understand how the use cases considered by Google Analytics: App + Web are comparable to the use cases of Universal Analytics.
I will definitely devote more resources to writing content for Firebase, as this new way of combining analytics between applications and websites is too interesting to ignore.
Let's discuss Google Analytics: App + Web in the comments, but remember that we are talking about a
beta product. You can freely express your disappointment about development decisions and missing features, but keep in mind that providing your criticism in a constructive way can lead to changes aimed at eliminating these criticisms in the final product, since the purpose of the beta version is to get feedback from the community.