For almost a year now I have been using the Yandex Music service and everything suits me. But there is one interesting page in this service - history. It stores all the tracks that have been listened in chronological order. And of course, I wanted to download it and analyze what I had heard there all the time.

First attempts
Starting to deal with this page, I immediately ran into a problem. The service does not download all the tracks at once, but only as you scroll. I did not want to download the sniffer and understand the traffic, and I had no skills in this business at that time. Therefore, I decided to go more simply by emulating the browser using selenium.
The script was written. But he worked very unstable and for a long time. But he did manage to load the story. After a simple analysis, I left the script without modifications, until after some time I again did not want to download the story. Hoping for the best, I launched it. And, of course, he gave an error. Then I realized that it was time to do everything humanly.
Working option
For the analysis of traffic, I chose Fiddler for myself because of a more powerful interface for http traffic, unlike wireshark. By running the sniffer, I expected to see requests for api with a token. But no. Our goal was at music.yandex.ru/handlers/library.jsx . And requests to it required full authorization on the site. We’ll start with her.
Login
Nothing complicated here. We go to passport.yandex.ru/auth , find the parameters for the requests and make two requests for authorization.
auth_page = self.get('/auth').text csrf_token, process_uuid = self.find_auth_data(auth_page) auth_login = self.post( '/registration-validations/auth/multi_step/start', data={'csrf_token': csrf_token, 'process_uuid': process_uuid, 'login': self.login} ).json() auth_password = self.post( '/registration-validations/auth/multi_step/commit_password', data={'csrf_token': csrf_token, 'track_id': auth_login['track_id'], 'password': self.password} ).json()
And so we logged in.
Download History
Next we go to music.yandex.ru/user/<user>/history , where we also pick up a couple of parameters that are useful to us when receiving information about the tracks. Now you can download the story. We get the music.yandex.ru/handlers/library.jsx at music.yandex.ru/handlers/library.jsx with parameters {'owner': <user>, 'filter': 'history', 'likeFilter': 'favorite', 'lang': 'ru', 'external-domain': 'music.yandex.ru', 'overembed': 'false', 'ncrnd': '0.9546193023464256'} . I was interested in the ncrnd parameter here. When prompted, Yandex always assigns different values to this parameter, but everything works with the same. Back we get the history in the form of id tracks and Detailed information about the top ten tracks. From the detailed track information, you can save a lot of interesting data for later analysis. For example, release year, track duration and genre. Information on the rest of the tracks is obtained from music.yandex.ru/handlers/track-entries.jsx . We save all this business in csv and we pass to the analysis.
Analysis
For analysis, we use standard tools in the form of pandas and matplotlib.
import pandas as pd import matplotlib.pyplot as plt df = pd.read_csv('statistics.csv') df.head(3)
Change the python's None to NaN and throw them away.
df = df.replace('None', pd.np.nan).dropna()
Let's start with a simple one. Let's see the time we spent listening to all the tracks
duration_sec = df['duration_sec'].astype('int64').sum() ss = duration_sec % 60 m = duration_sec // 60 mm = m % 60 h = m // 60 hh = h % 60 f'{h // 24} {hh}:{mm}:{ss}'
'15 15:30:14'
But here you can argue about the accuracy of this figure, because it is not clear which part of the track you need to listen to, Yandex added it to the story.
Now let's look at the distribution of tracks by year of release.
plt.rcParams['figure.figsize'] = [15, 5] plt.hist(df['year'].sort_values(), bins=len(df['year'].unique())) plt.xticks(rotation='vertical') plt.show()
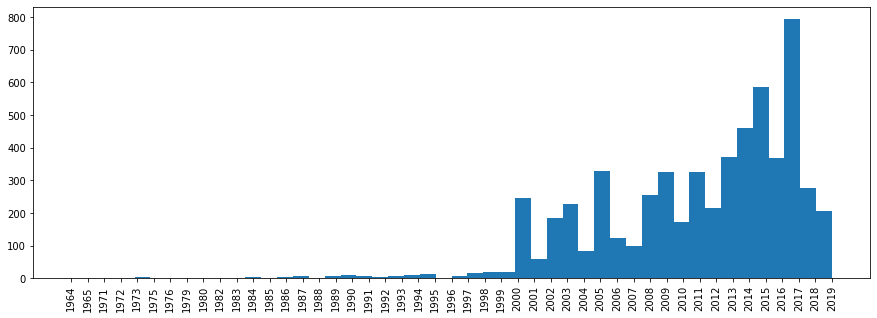
Here, the same is not so simple, as the diverse collections of “Best Hits” will have a later year.
Other statistics will be built on a very similar principle. I will give an example of the most listened tracks
df.groupby(['track_id', 'artist','track'])['track_id'].count().sort_values(ascending=False).head()
and most played tracks of the artist
artist_name = 'Coldplay' df.groupby([ 'artist_id', 'track_id', 'artist', 'track' ])['artist_id'].count().sort_values(ascending=False)[:,:,artist_name].head(5)
Full code can be found here.