Content:
How can countries be compared by cost of living now?About purchasing power parityWhy BIM (engineers and coordinators)Conclusion 1. Miscellaneous gross - equal netConclusion 2. The smaller the gross, the larger m²Where did the data come fromMethodology for calculating PPP indicatorsQuite often, in conversation with people from other countries, we begin to
compare wage levels . Although gross income may vary significantly,
purchasing power is likely to
remain at approximately the same level , which is especially evident in the real estate market.
Is the grass "greener" - on the other side?
Thanks to the
LinkedIn social network, - I talked with many specialists in my industry who
work in other countries and collected salary data (data was also taken from
payscale.com ). And he calculated the
parity (PPP) in other cities in relation to the salary in my hometown of St. Petersburg (PPP data was taken from
Numbeo.com ).
How can countries be compared by cost of living now?
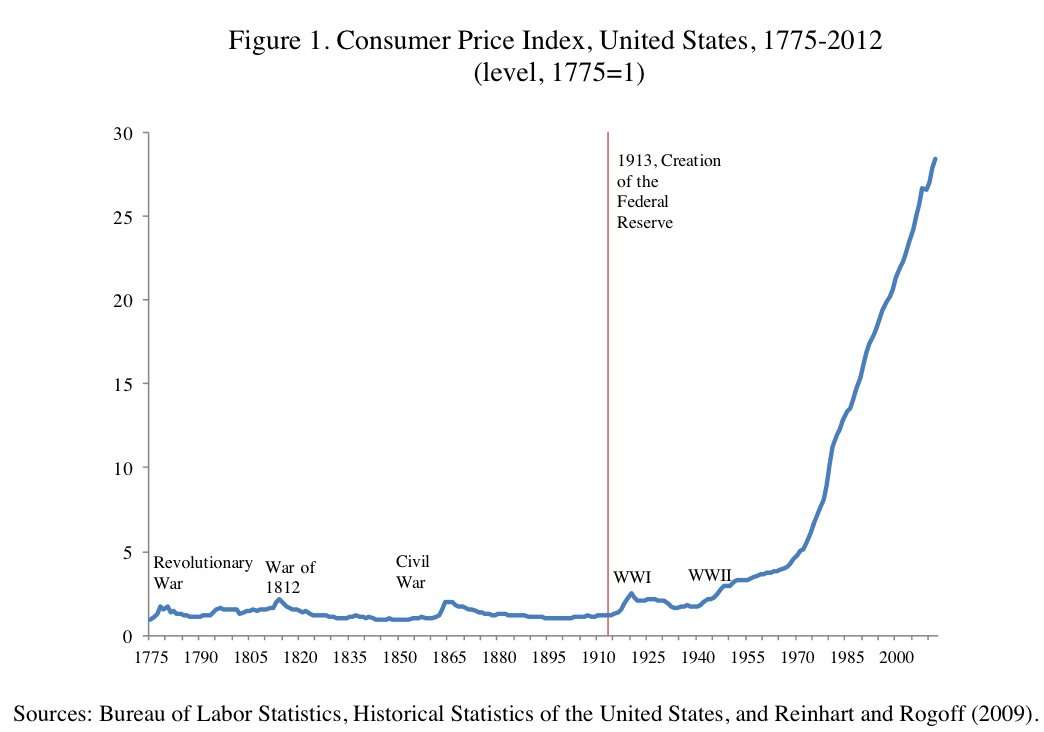
The constant increase in prices for goods and services in the world, which is associated with
lower interest rates around the world since 1980, today does not allow a person who is
planning to move to another country to get an idea of the cost of living and the cost of services in a foreign country.
The graph shows the median interest rates in the world over the past 200 years, which until 1980 were around the world at a balanced and reasonable level: about 4-6% :

Lowering interest rates and decoupling the dollar from the gold standard in 1971 led the world to inflation , which became a 21st century phenomenon.
The same phenomenon from German analysts at Deutsche Bank.

As a result of these events, the following countries are established:
1. Mismatched interest
rates of central banks1 -> 2. Inhomogeneous
inflation1 & 2 -> 3. Different
real estate prices1 & 2 & 3 -> 4. Unequal
price levels1 & 2 & 3 & 4 -> 5. Unequal
cost of livingHow can we now compare the “Cost of Living” in different countries of the world?
To assess life in another country, we can use the concept - Purchasing Power Parity (PPP) - Purchasing Power Parity: PPP
Pro Purchasing Power Parity (PPP)
Purchasing power parity - the ratio of two or more monetary units, currencies of different countries, established by their purchasing power in relation to a certain set of goods and services
Read more: Purchasing Power Parity
?Big Mac Price: p1
Berlin-4,70$ / New York-5,70$ / Saint Petersburg-2,10$
Big Mac ( ) to Saint Petersburg: p2=p1/2,10
Berlin-2,2 / New York-2,70 / Saint Petersburg-1
= : p3
Berlin-2085$ / New York-3900$ / Saint Petersburg-1150$
-
-: p4=p3/p2
Berlin-940$ / New York-1470$ / Saint Petersburg-1150$- $ 50
( — 19 ., -11 .)
:
() -: « » Toyota .
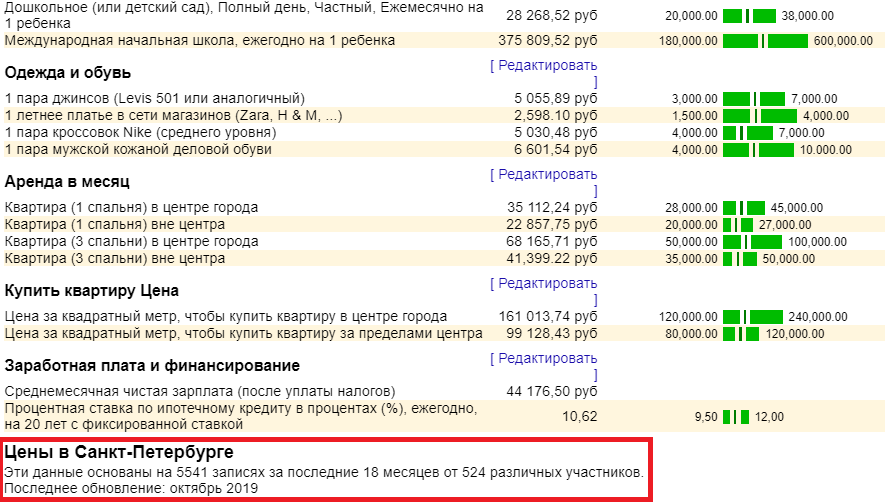
Numbeo.com (
18 , «» ). , :
.
( 50) - ( - 18 — 524):
50 ( « » Toyota ). ( , : , 4- : — 60., - 22 ., Levis 501 — 0.3 , c Nike — 0.3 ( 4 ), — 100% , Toyota — 0.0035 (.. 20 )):
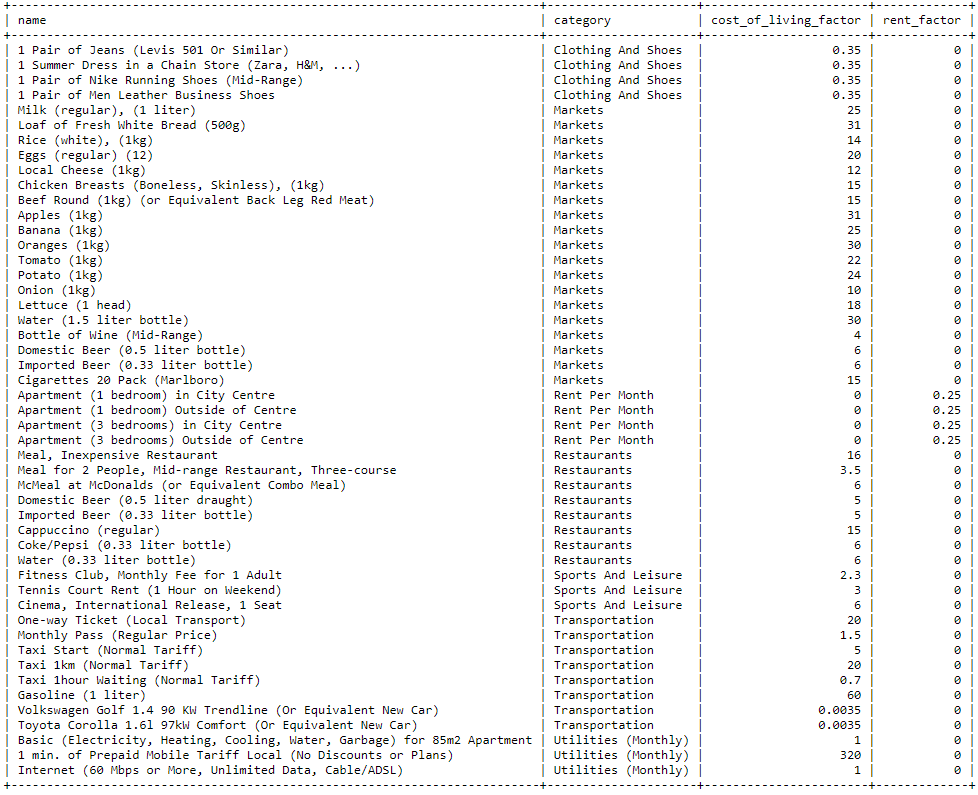
Local_Puchasing_Power_Index = (Average_Disposable_Salary(This_City) /
BasketConsumerPlusRent(This_City)) / (Average_Disposable_Salary(New_York) /

BasketConsumerPlusRent(New_York)) BasketConsumerPlusRent(City) =
sum_of (Price_in_the_city * (cost_of_living_factor + rent_factor))
() - ()
C -- - ()

— ,
(
Numbeo.com). , , N — , ,
N.
BIM ( )
BIM- ( 1-2 ) -
( BIM- — «», BIM-). BIM- ( 4-6 ), , , .
,
BIM,
80% .
3 % ( 12%). BIM- — .
BIM ( 2000 ) — : 20 30 . . — BIM / BIM / BIM: 100% / 125% / 150%. ,
, , BIM
BIM.
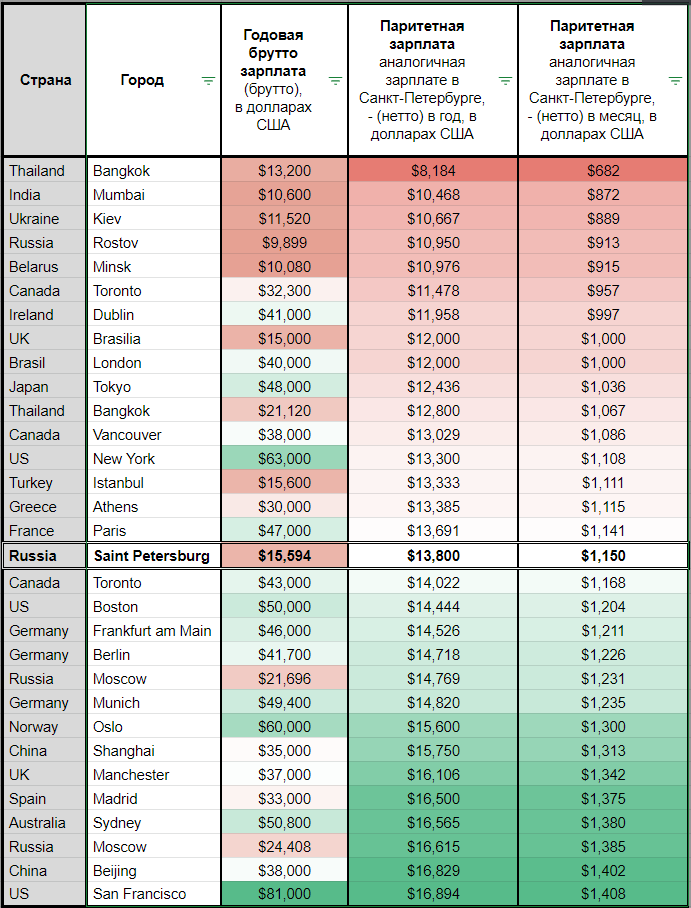
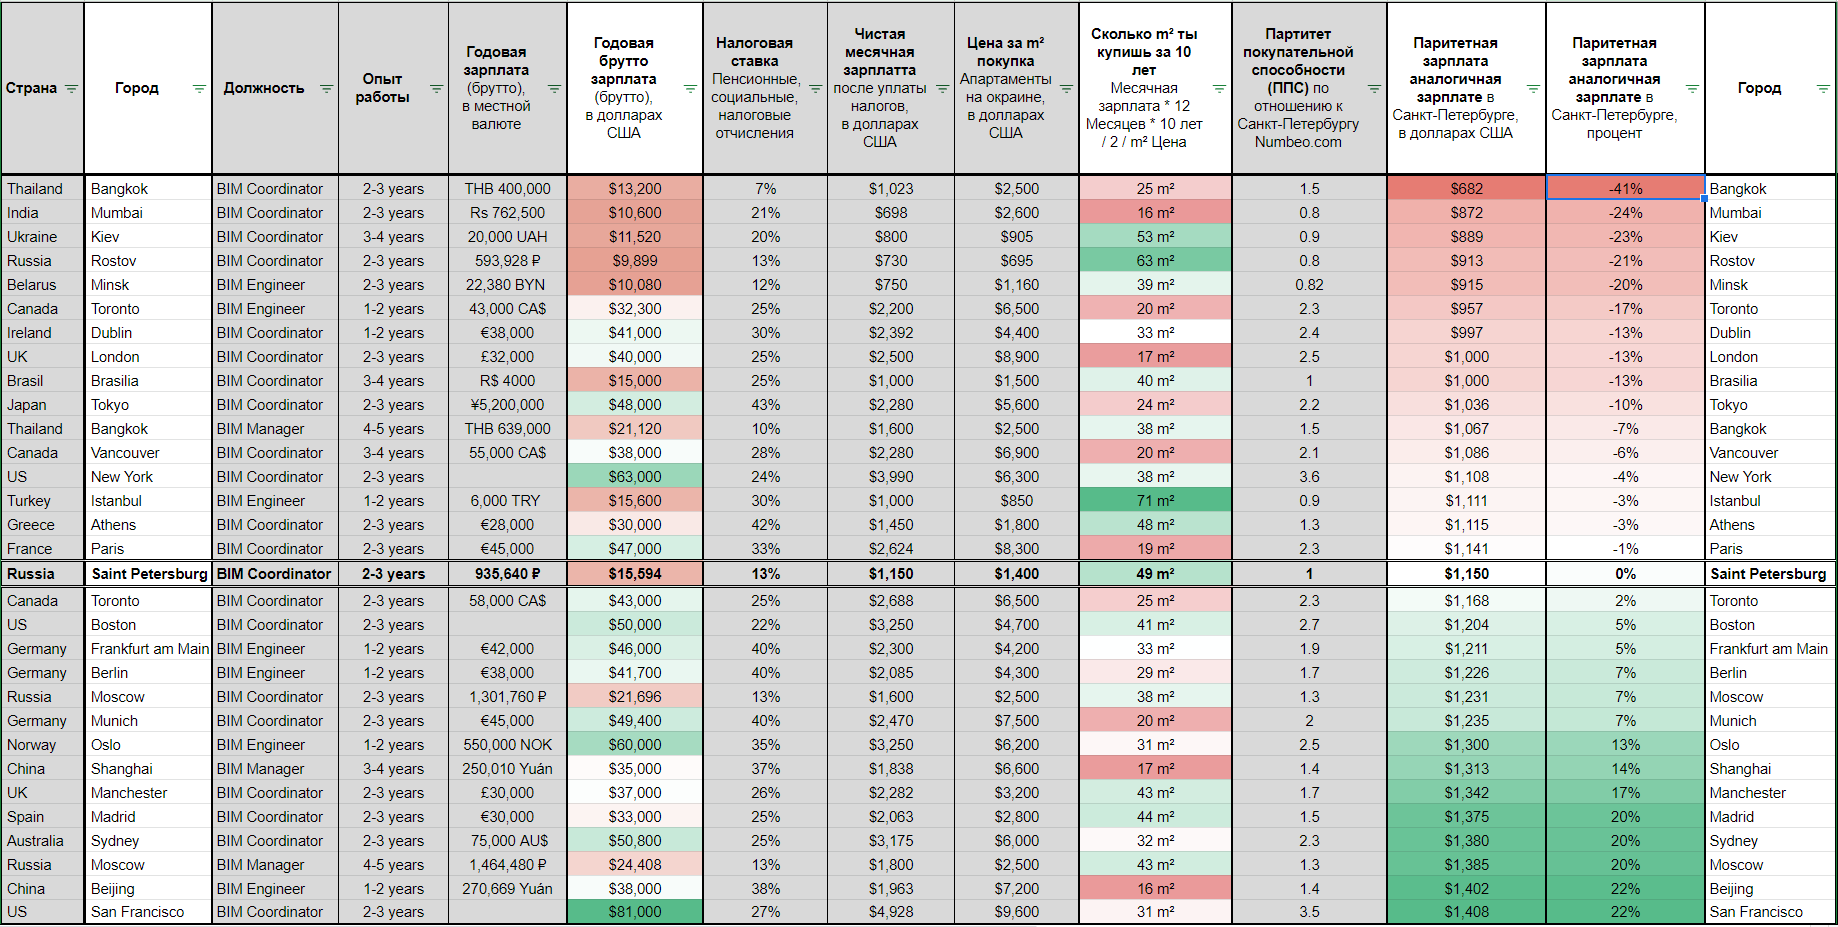
:
1. ( ) , , , .
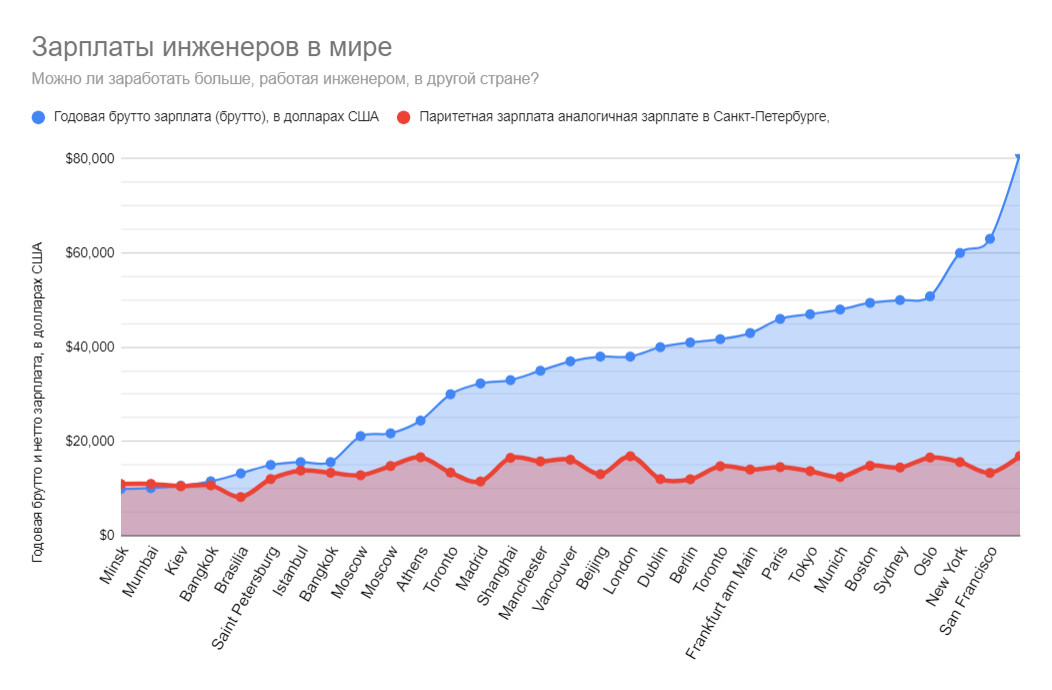
,
vs -
8 ,
2 .
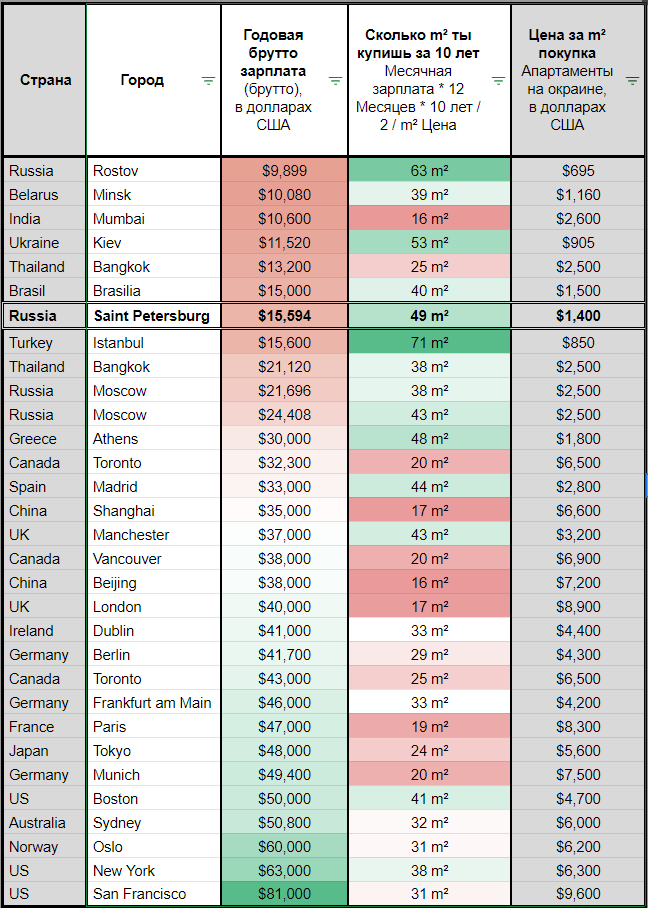
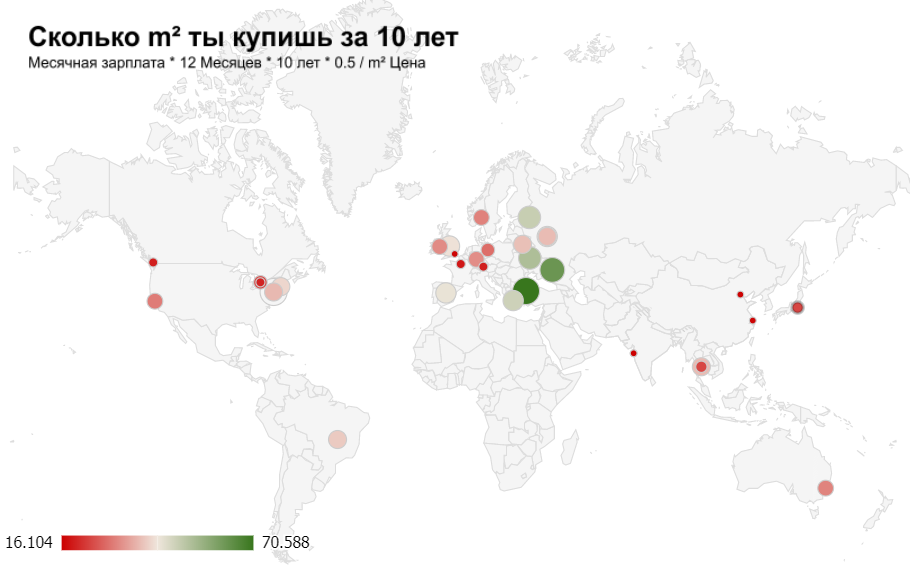
2. , m² 10 .
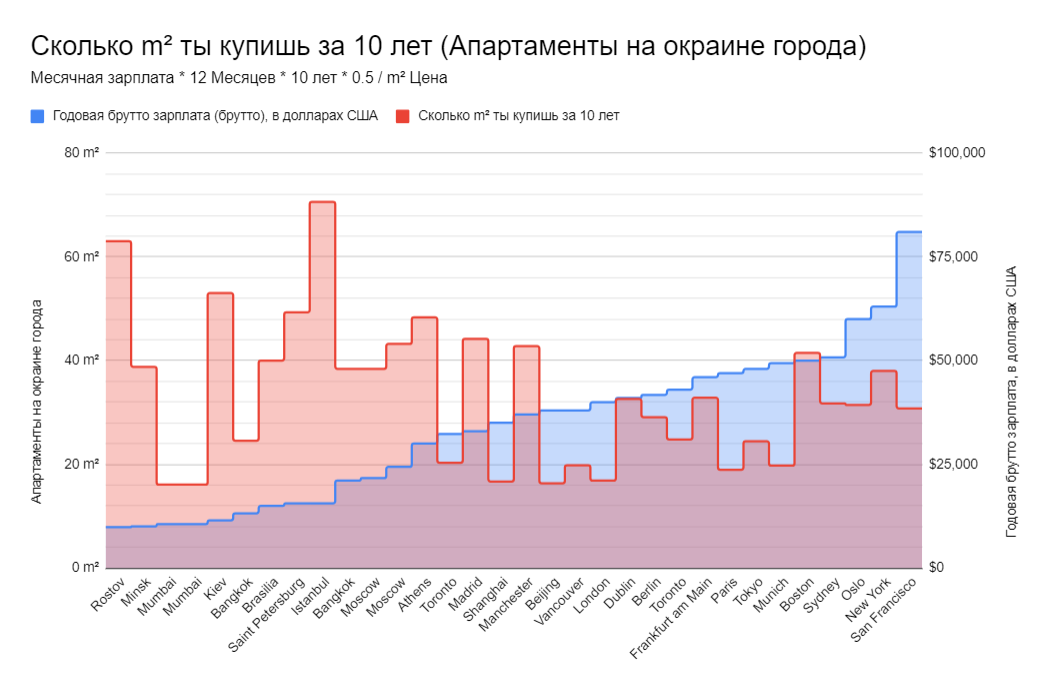
( 10 ) ( )
46 ² 31 ² -.
. , —
, .
.
, .
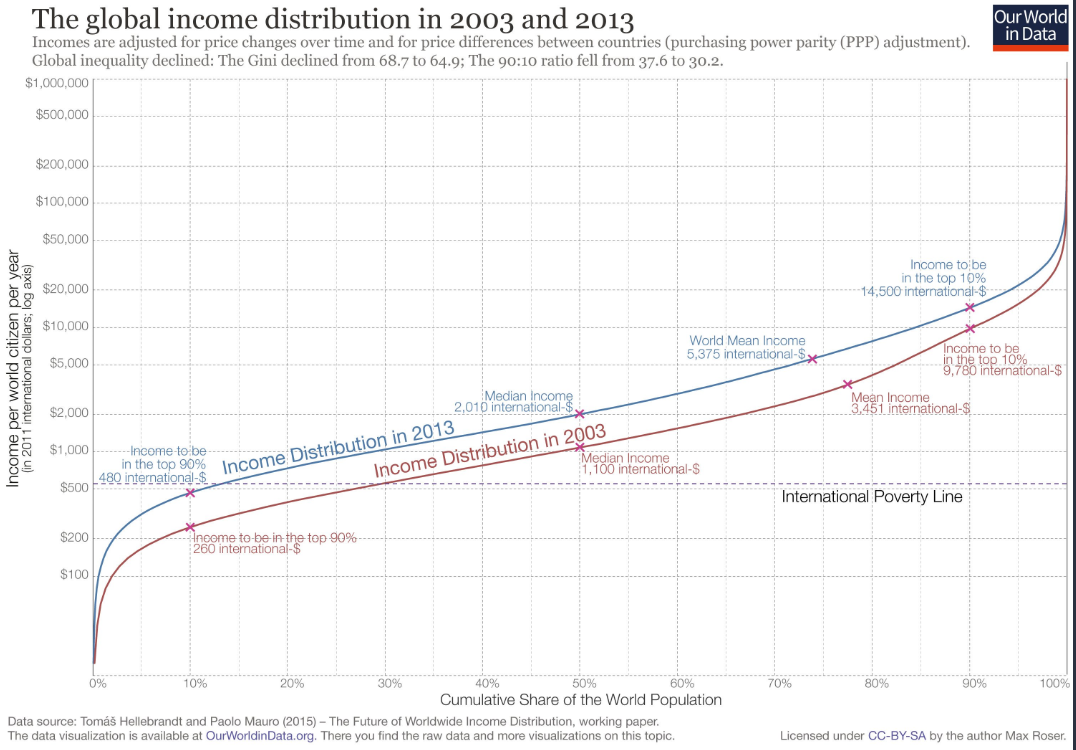
, -10% — $14 500
.
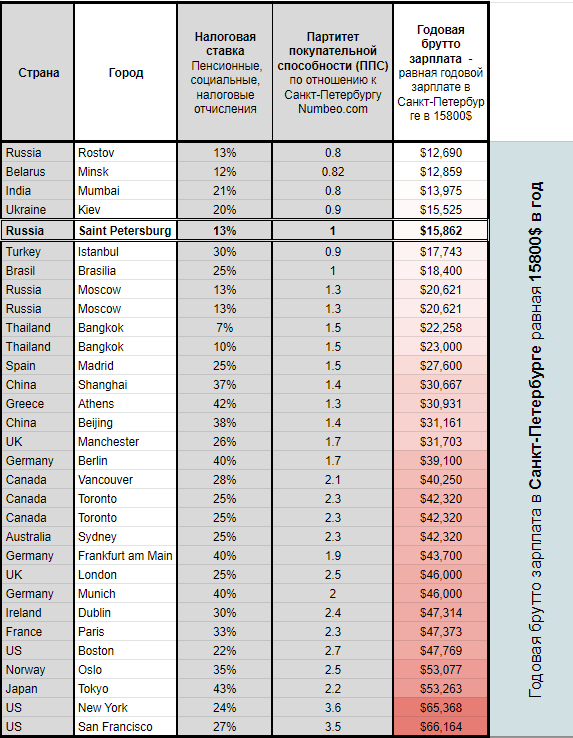
, — — -
15,800$ ( 1,150$ 71,000 ).
, , 47,000$ , — 71,000 . -.
,
, , .
.
LinkedIn ( ).
Will you have more Salaries in another country? Not really… Engineering Salaries Worldwide.LinkedIn, :
Artem Boiko-
± 10%(Google Spreadsheet)
BIM Salarys vs PPP( , ) «BIM Russian expats» LinkedIn —
https://www.linkedin.com/groups/8834618/:
https://www.payscale.com/research:
https://neuvoo.com/tax-calculator/m² :
https://www.numbeo.com/property-investment/() :
https://www.numbeo.com/cost-of-living/comparison.jspPS.
— . . !
, , , .