迷路で遊ぶときの古典的な仕事は、入口から出口への通路を見つけることです。 ソリューションパスは、ラビリンスマップに描画されます。 ほとんどの場合、ラビリンスは、ディープサーチなどのアルゴリズムを使用するコンピューターによって生成されます。 興味深いことに、迷路は同じアルゴリズムを使用して解決できます。
迷路を読む
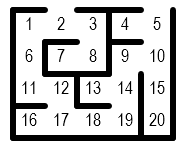
迷路はさまざまな形式で表現できます。 この場合、SVGを使用してソリューションを簡単に描画できるため、SVGを使用します。
SVGの迷路の例:<?xml version="1.0" standalone="no"?> <!DOCTYPE svg PUBLIC "-//W3C//DTD SVG 1.1//EN" "http://www.w3.org/Graphics/SVG/1.1/DTD/svg11.dtd"> <svg width="112" height="96" version="1.1" xmlns="http://www.w3.org/2000/svg"> <rect width="112" height="96" fill="white" stroke="none" /> <title>5 by 4 orthogonal maze</title> <g fill="none" stroke="#000000" stroke-width="3" stroke-linecap="round" stroke-linejoin="round"> <line x1="16" y1="16" x2="32" y2="16" /> <line x1="48" y1="16" x2="80" y2="16" /> <line x1="16" y1="80" x2="96" y2="80" /> <line x1="16" y1="16" x2="16" y2="80" /> <line x1="96" y1="16" x2="96" y2="80" /> <line x1="64" y1="16" x2="64" y2="32" /> <line x1="32" y1="32" x2="32" y2="48" /> <line x1="32" y1="32" x2="48" y2="32" /> <line x1="64" y1="32" x2="64" y2="48" /> <line x1="64" y1="32" x2="80" y2="32" /> <line x1="32" y1="48" x2="48" y2="48" /> <line x1="48" y1="48" x2="48" y2="64" /> <line x1="48" y1="48" x2="64" y2="48" /> <line x1="80" y1="48" x2="80" y2="64" /> <line x1="16" y1="64" x2="32" y2="64" /> <line x1="48" y1="64" x2="64" y2="64" /> <line x1="80" y1="64" x2="80" y2="80" /> </g> <g fill="black" stroke="none" stroke-width="1"> <text x="24" y="26" text-anchor="middle" style="font-family:Arial Narrow; font-size: xx-small;">1</text> <text x="40" y="26" text-anchor="middle" style="font-family:Arial Narrow; font-size: xx-small;">2</text> <text x="56" y="26" text-anchor="middle" style="font-family:Arial Narrow; font-size: xx-small;">3</text> <text x="72" y="26" text-anchor="middle" style="font-family:Arial Narrow; font-size: xx-small;">4</text> <text x="88" y="26" text-anchor="middle" style="font-family:Arial Narrow; font-size: xx-small;">5</text> <text x="24" y="42" text-anchor="middle" style="font-family:Arial Narrow; font-size: xx-small;">6</text> <text x="40" y="42" text-anchor="middle" style="font-family:Arial Narrow; font-size: xx-small;">7</text> <text x="56" y="42" text-anchor="middle" style="font-family:Arial Narrow; font-size: xx-small;">8</text> <text x="72" y="42" text-anchor="middle" style="font-family:Arial Narrow; font-size: xx-small;">9</text> <text x="88" y="42" text-anchor="middle" style="font-family:Arial Narrow; font-size: xx-small;">10</text> <text x="24" y="58" text-anchor="middle" style="font-family:Arial Narrow; font-size: xx-small;">11</text> <text x="40" y="58" text-anchor="middle" style="font-family:Arial Narrow; font-size: xx-small;">12</text> <text x="56" y="58" text-anchor="middle" style="font-family:Arial Narrow; font-size: xx-small;">13</text> <text x="72" y="58" text-anchor="middle" style="font-family:Arial Narrow; font-size: xx-small;">14</text> <text x="88" y="58" text-anchor="middle" style="font-family:Arial Narrow; font-size: xx-small;">15</text> <text x="24" y="74" text-anchor="middle" style="font-family:Arial Narrow; font-size: xx-small;">16</text> <text x="40" y="74" text-anchor="middle" style="font-family:Arial Narrow; font-size: xx-small;">17</text> <text x="56" y="74" text-anchor="middle" style="font-family:Arial Narrow; font-size: xx-small;">18</text> <text x="72" y="74" text-anchor="middle" style="font-family:Arial Narrow; font-size: xx-small;">19</text> <text x="88" y="74" text-anchor="middle" style="font-family:Arial Narrow; font-size: xx-small;">20</text> </g> </svg>
ファイルを2つのレギュラーで処理します-1つはサイズ用で、もう1つは行を見つけるためです。
サイズ:
m/<title>([0-9]*)\sby\s([0-9]*).*/g
行:
m/<line x1=\"([0-9]+)\" y1=\"([0-9]+)\" x2=\"([0-9]+)\" y2=\"([0-9]+)\" \/>+/g
行を格納する構造にデータを渡しましょう。これは次のようになります。
{ "x1" => 0, "y1" => 0, "x2" => 0, "y2" => 0 }
svgファイルでは、すべてのデータは16の係数に基づいています。したがって、xとyを16で除算し、増加するシーケンスを取得します。
ファイルで最後に行うことは、行と列の数を保存することです。 これは、レギュラーシーズンから取得した最初のグループになります。
隣人のリストを作成します
開始する前に最後にやることは、隣人のリストを作成することです。 これは、目的の要素に隣接するすべての要素のリストです。
上記の迷路のリスト出力:
1: 2 6 2: 0 3 1 3: 8 2 4: 5 5: 0 10 4 6: 1 11 7: 8 8: 3 7 9: 10 14 10: 5 15 9 11: 6 12 12: 17 11 13: 14 14: 9 19 13 15: 10 20 16: 17 17: 12 18 16 18: 19 17 19: 14 18 20: 15
これは簡単なことではありません。隣人を遮断する「壁」の線を考慮する必要があります。 これを行うには、最初にすべての隣人を見つけます。 到達できないものは-1としてマークされます。 その他は正数で示されます。
次に、すべての行を並べ替え、接続していない隣人を除外します。 最後に、配列内のすべての隣接ノードをリストし、上記のように出力します。
ネイバーのリストを受け取ったら、アルゴリズムの使用を開始します。
深さ検索
グラフを使用すると、各ノードを通過してノードを反復処理できます。 それらを3つのカテゴリに分けましょう。
-黒-ノットが見つかりました
-グレー-見つかったが処理されていない
-白-見つかりません
次に、ランダムノードから始めて、すべての隣接ノードを回ります。 各隣接ノードを検出済みとしてマークし、すべてのノードをソートするまでこれらの手順を繰り返します。
擬似コードでは、次のようになります。
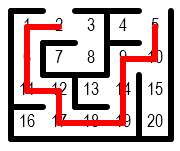
決定の結論
これが最も簡単な手順です。 各セルの中心(左上+ rightbot2)を見つけて線を引きます。
上記すべてのコード @ARGV = ("/PATH/05.svg"); undef $/; $input=(<>); $idx = 1; my $rows; my $cols;
出力をsvgファイルに追加する必要があります。
<g fill="none" stroke="#FF0000" stroke-width="3" stroke-linecap="round" stroke-linejoin="round"><line x1="88" y1="24" x2="88" y2="24" /> <line x1="88" y1="24" x2="88" y2="40" /> <line x1="88" y1="40" x2="72" y2="40" /> <line x1="72" y1="40" x2="72" y2="56" /> <line x1="72" y1="56" x2="72" y2="72" /> <line x1="72" y1="72" x2="56" y2="72" /> <line x1="56" y1="72" x2="40" y2="72" /> <line x1="40" y1="72" x2="40" y2="56" /> <line x1="40" y1="56" x2="24" y2="56" /> <line x1="24" y1="56" x2="24" y2="40" /> <line x1="24" y1="40" x2="24" y2="24" /> <line x1="24" y1="24" x2="40" y2="24" /> <line x1="40" y1="24" x2="40" y2="24" /> </g>