www.elastic.co/downloads/beats/winlogbeatをダウンロードし
ます 。 C:\に展開し、Winlogbeatに名前を変更します。 管理者からPowerShellを実行し、サービスをインストールします。
PS C:\Users\Administrator> cd 'C:\Winlogbeat' PS C:\Winlogbeat> .\install-service-winlogbeat.ps1
システムでスクリプトがデフォルトで無効になっていることを示すメッセージが表示された場合(および無効になります)、Winlogbeatのポリシーを作成します。
PowerShell.exe -ExecutionPolicy UnRestricted -File .\install-service-winlogbeat.ps1
Security warning Run only scripts that you trust. While scripts from the internet can be useful, this script can potentially harm your computer. If you trust this script, use the Unblock-File cmdlet to allow the script to run without this warning message. Do you want to run C:\Program Files\Winlogbeat\install-service-winlogbeat.ps1? [D] Do not run [R] Run once [S] Suspend [?] Help (default is "D"): R Status Name DisplayName ------ ---- ----------- Stopped winlogbeat winlogbeat
サービスを開始する前に、設定を編集します-C:\ Winlogbeat \ winlogbeat.yml。
output: #elasticsearch: # hosts: localhost:9200 logstash: hosts: ["ip_elk-server.ss.lu:5044"]
event_logsブロックには、Logstashに転送する必要があるメインシステムログがリストされます。
winlogbeat: registry_file: C:/ProgramData/winlogbeat/.winlogbeat.yml event_logs: - name: Application - name: Security - name: System logging: to_files: true files: path: C:/winlogbeat/winlogbeat/Logs level: info
他のログはevent_logsに追加できます。そのリストは次のように表示できます。
PS C:\Users\Administrator> Get-EventLog *
システムがVistaよりも高い場合、チャネルを指定できます。
PS C:\Users\Administrator> Get-WinEvent -ListLog * | Format-List -Property LogName
次に、toplog、filebeat、packetbeatの場合と同様に、winlogbeatのインデックスをサーバーにアップロードする必要があります。 これはリモートで実行できます。
PS C:\Winlogbeat> Invoke-WebRequest -Method Put -InFile winlogbeat.template.json -Uri http://IP_address_elk-server:9200/_template/winlogbeat?pretty
この方法には問題があるため、次のことができます。
サーバーにwinlogbeat.template.jsonインデックスファイルを作成します。
sudo vi〜/ ELK / releases / beats / winlogbeat / winlogbeat.template.json。 Windowsクライアントで、ファイル
C:\ winlogbeat \ winlogbeat.template.jsonを開き 、その内容を
〜/ ELK / releases / beats / winlogbeat / winlogbeat.template.jsonファイルにコピーします。
{ "mappings": { "_default_": { "_all": { "enabled": true, "norms": { "enabled": false } }, "dynamic_templates": [ { "template1": { "mapping": { "doc_values": true, "ignore_above": 1024, "index": "not_analyzed", "type": "{dynamic_type}" }, "match": "*" } } ], "properties": { "@timestamp": { "type": "date" }, "message": { "index": "analyzed", "type": "string" } } } }, "settings": { "index.refresh_interval": "5s" }, "template": "winlogbeat-*" }
次に(サーバー上で)このインデックスをelasticsearchにロードして、情報を正しく分析し、通常の形式で提供できるようにします。
winlogbeat.template.jsonファイルを作成したディレクトリに
移動します。
cd ~/ELK/releases/beats/winlogbeat ll 12 drwxr-xr-x 2 root root 4096 . 8 23:10 ./ drwxr-xr-x 7 root root 4096 . 8 16:00 ../ -rw-r--r-- 1 root root 729 . 8 23:10 winlogbeat.template.json
出力は次のようになります。
{"acknowledged":true}
クライアントにアクセスして、winlogbeatサービスを開始します。 その後、Kibanaを介してデータの監視を開始し、読み込まれたインデックスによって表示を決定します。
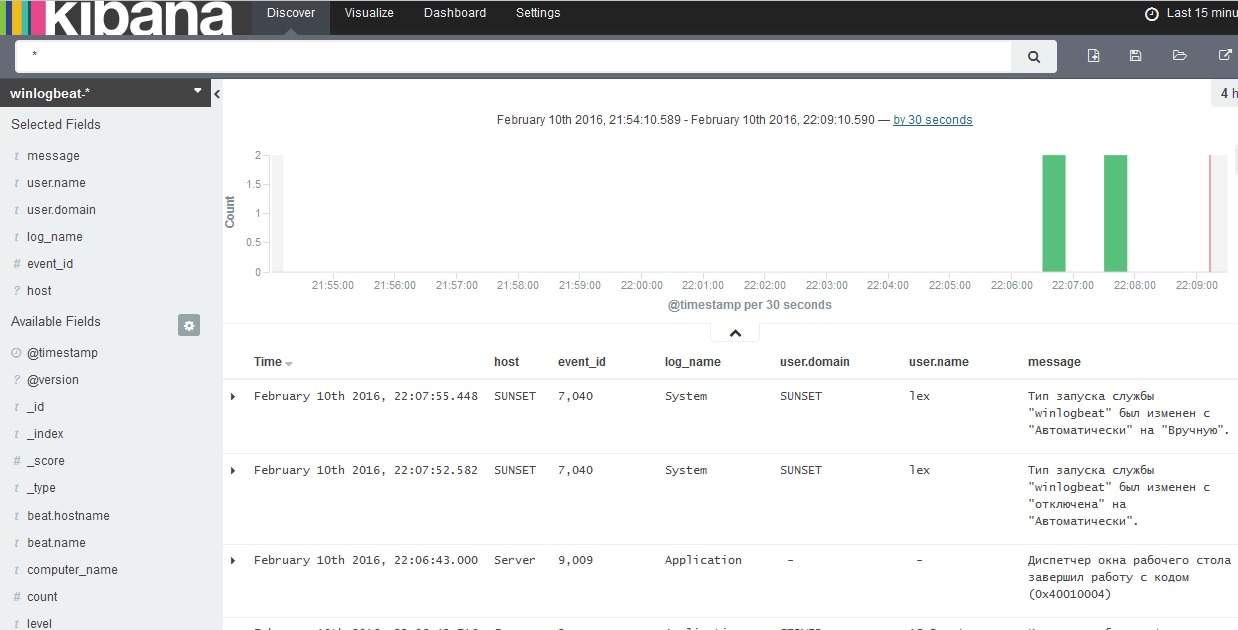
ダッシュボードを見ます:
