機械学習の非常に基本的なことをマスターすることになると、多くの場合、
PythonまたはRで適切なツールを学ぶことをお勧めします
。 彼らの長所と短所については説明しませんが、.NETエコシステムに精通しているだけで、データサイエンスの世界に突入したい場合はどうすればよいのかを自問してください。 答えは簡単です。絶望せずに
F#の方向に目を向けます
。.NETの私のようにC#の基本だけを知っているなら、
Accord.NET Frameworkを勉強してみてください。
分類問題を解決
するためのアプリケーションをすでに検討しましたが、今回は線形回帰の最も簡単なツールを検討してみます。 これを行うために、我々は
モスクワ市長の公式
ウェブサイトから取られた市民の訴えの分析に関する公開データを使用します。
記事のタイトルで
C#が示されているという事実にもかかわらず、
VB.NETでもコードを収集しようとし
ます 。
私はあなたをカットに招待する必要があります!

この
ようなコメントを
避けるために 、私は
モスクワ政府 、政府、都道府県など
とは何の関係もないと、最初からすぐに言います。 したがって、
私は彼らの仕事について不平を言うのは意味がありません 。
このデータを偶然見つけ
て 、手動でタブレットに打ち込んで
GitHubに投稿しました。
まあ、もし誰かが興味があるなら、この記事は私がデータサイエンスをゼロから研究した方法に捧げられたミニサイクルを続けます
(そして実際にはそれを学びませんでした) 、誰かが興味があるなら、私はネタバレの下に他の記事へのリンクを隠しました。
私は正直に言って、私はプログラマーではなく、非常に表面的にAccord.NETを勉強しました。 残念ながら、その上に多くの文献がなく、すぐに利用できるオンライントレーニングコースもなかったため、多くの点で開発者のサイトのみが残っており、私たちが望むほど有益ではありません。
したがって、上記で提案したデータセットを使用して
、サイクルの最後の
記事で基本的な操作を実行しました(データセットの詳細な説明もあります)。 そしてこの記事では、きしむ音でデータを読み、モデルを訓練し、ある種のグラフを作成しようとします。
内容:
パートI:データの概要と少しパートII:C#コードの記述パートIII:VBコードと結論の作成コードの記述を開始する前に、データについて2語で説明します。
これは、モスクワ市のさまざまな執行機関が受け取った市民の訴えの分析に関する公開データです。 統計は乏しいと言わざるを得ませんが、これまでのところわずか22か月です。
実際、それは23か月だったかもしれませんが、11月に開発者が不完全なデータセットを提供したので、私はそれを含めませんでした。
データはcsv形式で表示されます。 データ列の意味は次のとおりです。
num –
year –
month –
total_appeals –
appeals_to_mayor –
res_positive-
res_explained –
res_negative –
El_form_to_mayor –
Pap_form_to_mayor - to_10K_total_VAO…to_10K_total_YUZAO – 10000
to_10K_mayor_VAO… to_10K_mayor_YUZAO– 10000
データ収集プロセスを自動化する方法を見つけられなかったため、結果を手作業で収集する必要があったため、どこかで少し間違える可能性があります。まあ、データの信頼性は著者の良心に任せます。
フレームワーク自体についてほんの少しの言葉を伝えるだけで、コードにアクセスできます。
Accord.NETは
オープンソースプロジェクトですが、ほとんどの場合、LGPLライセンスの下で商業開発に使用できます。 フレームワークには、統計的仮説のテストからニューラルネットワークまで、データ分析と機械学習に必要なすべての基本的なツールがあるようです。
これで、良心を持ってコードにアクセスできます。
C#とVB.NETのプロジェクトのソリューションを
GitHubに投稿しました。ダウンロードしてビルドを試みることができます(理論的には開始する必要があります)。 プロジェクトをゼロから自分で作成する場合、同様の機能を使用するには、次のことを行う必要があります。
- 新しいプロジェクトを作成します(Net Framework 4.5でコンソールプロジェクトを作成しました)。
- パッケージマネージャー(NuGet)を使用して、Accord.Controlsバージョン3.8(必要な他のすべてのパッケージをプルします)、およびテーブルを操作するためのAccord.IOをインストールします。 また、グラフを描画するには、標準のWindows.Formsライブラリを有効にする必要があります。 実際にコードを書くことができるのはそれだけです。
スポイラーの下に完全なC#コードを配置します。
C#の完全なコード using System; using System.Linq; using Accord.Statistics.Models.Regression.Linear; using Accord.IO; using Accord.Math; using System.Data; using System.Collections.Generic; using Accord.Controls; using Accord.Math.Optimization.Losses; namespace cs_msc_mayor { class Program { static void Main(string[] args) {
多くの点で、線形回帰問題の解決策
は開発者サイトの例から取られていますが、すべてはそれほど複雑ではありませんが、それでも部分的にコードを分析しましょう。
using System; using System.Linq; using Accord.Statistics.Models.Regression.Linear; using Accord.IO; using Accord.Math; using System.Data; using System.Collections.Generic; using Accord.Controls; using Accord.Math.Optimization.Losses;
サードパーティライブラリのネームスペースをロードします。
namespace cs_msc_mayor { class Program { static void Main(string[] args) {
名前空間、クラス、メインメソッドを作成します-すべては簡単です。
データを制御サンプルとトレーニングサンプルに分割するのに後で役立つ変数を決定します。
これは、Pythonプロジェクトバージョンと.NETバージョン
(少なくとも私にとって)の両方で分数部分の区切り文字が同じように読み取られるために役立ちます。
データをcsvファイルからデータテーブル形式に読み取ります。
呼び出しが発生した月に関するデータを処理するには、それらを消化可能な形式に変換する必要があります。この場合、すべてを二重にエンコードします。
Pythonのソリューションとの類推により、まず辞書を作成し、次にループを使用してそれに応じてデータをトランスコードします。
目的関数を選択します。 すべての申し立てに対する肯定的な決定の数を予測します。
最初の行では、このデータをテーブルから取得し、double型に変換します。
次に、他の2つの変数に、トレーニングサンプルの場合は0〜18の位置、コントロールサンプルの場合は18〜22の位置をコピーします。
目的関数、月、年、およびヒットの総数には、レビューの肯定的な結果に関する情報が含まれているため、テーブルから不要な列を削除します。
次に、トランスコードされた月を含む列を追加します。最初に新しい列を作成し、テーブルに追加してから、ループに入力します。
目的関数との類推によって、入力データ(機能)の配列を作成します。
モデルを作成することは残っています。 最初に、通常の線形回帰のオブジェクトを作成し、それに基づいて、ほぼ30の兆候があるため、重回帰のモデルを作成します。 トレーニングセットでモデルを自然にトレーニングします。
トレーニングサンプルの予測を直接取得します。
予測値と実際の値に関するデータ、およびエラーと決定係数に関する情報をコンソールに表示します。
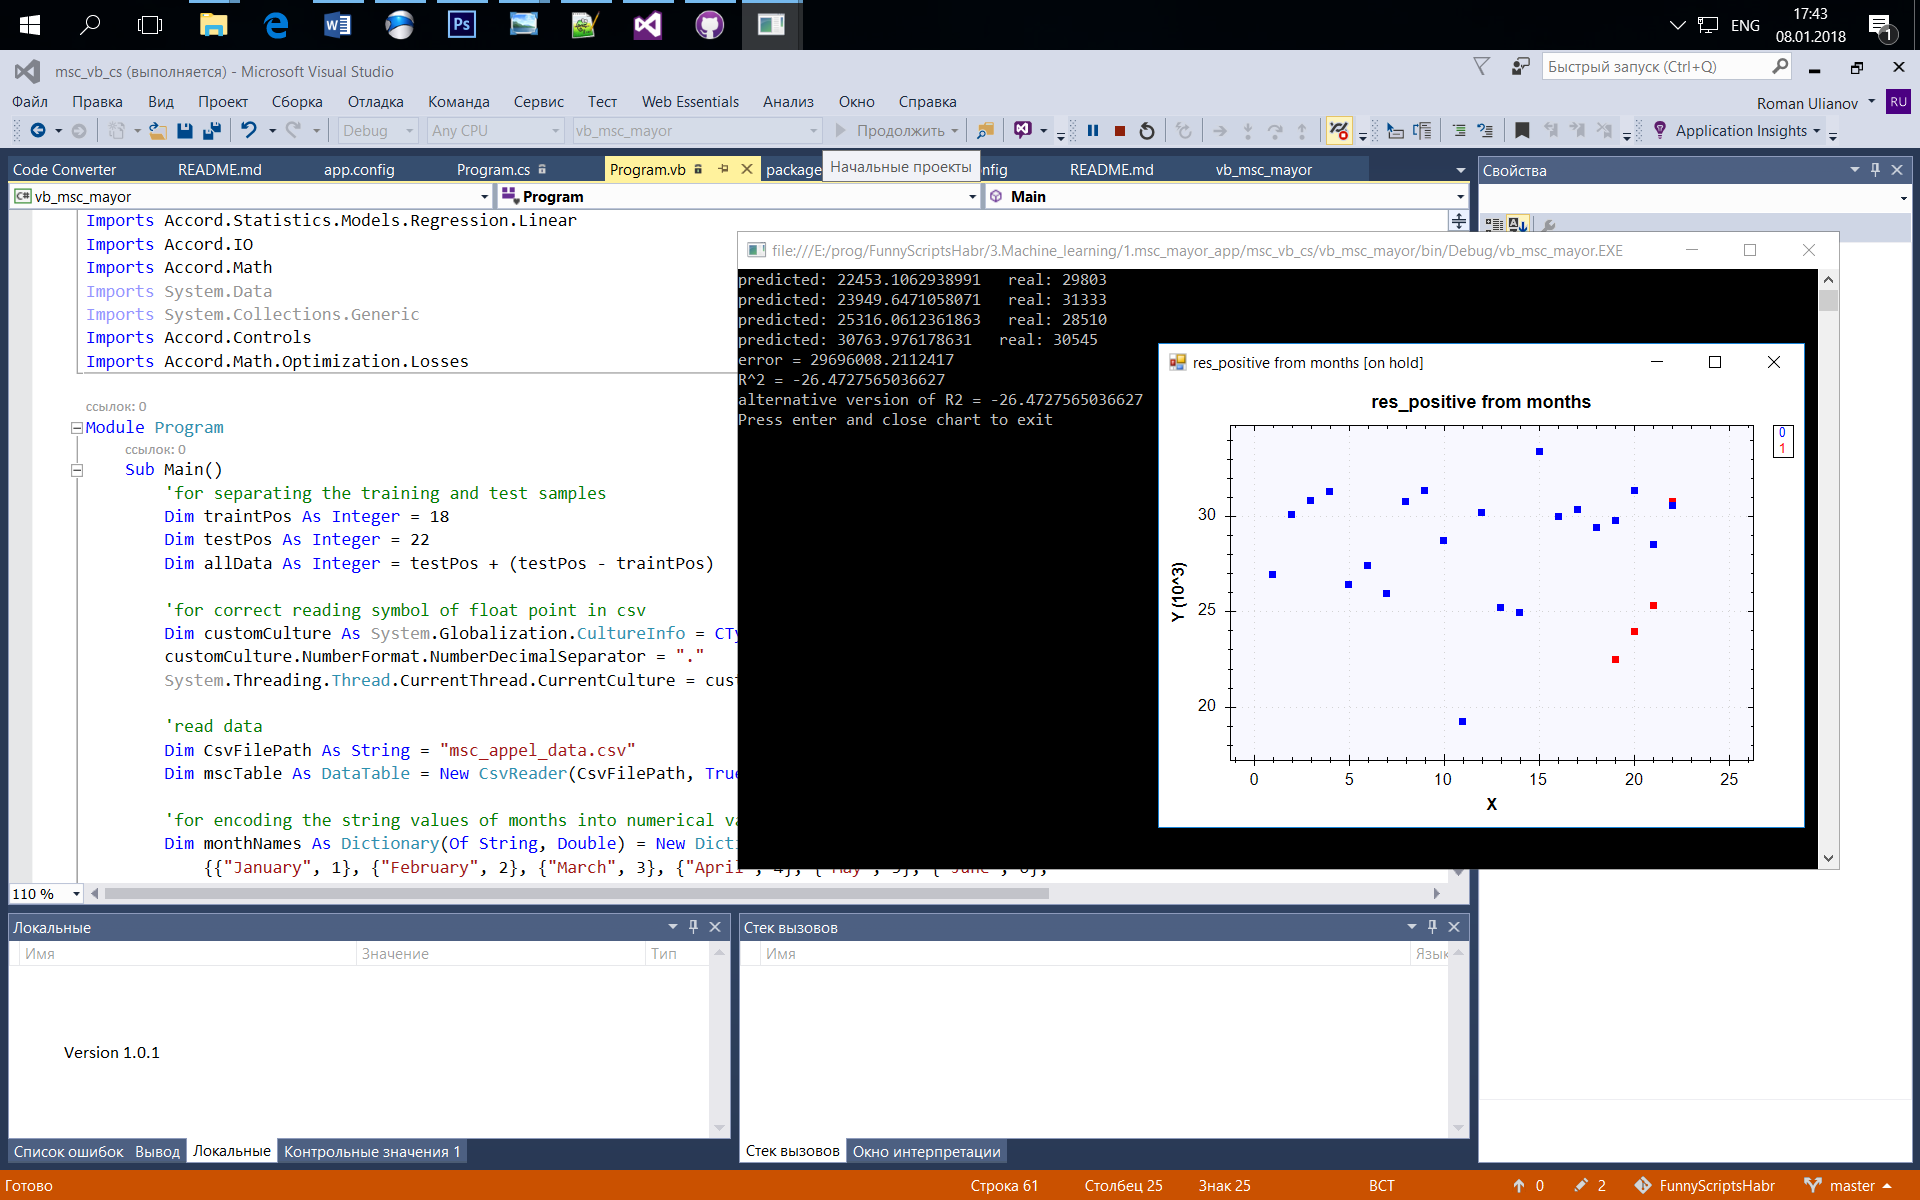
開発者は、チャートを表示するためにサードパーティのツールを使用するように助言しているようですが、ポイントを表示するフレームワークに付属のScatterplotBoxチャートを使用します。 データが少なくとも何らかの形で視覚的になるように、Xスケールで時間トレンドの類似物を作成し(ポイント1は1月16日、最後のポイントは2017年10月)、最初の22は初期データであり、最後の4は予測される別の配列にポイントを分類します(グラフ別の色で塗ります)。
ScatterplotBox.Showは、チャートを含むウィンドウを表示します。 X軸とU軸について以前に準備したデータを彼に提供します。
正直なところ、私はVisual Basicを知りませんが、ここで
はC#からVB.NETへのコンバーターが役立ちます。
コードを部分的に分析することはありません。コードに残されたコメントを参考にすることができます。コメントは両方のプロジェクトで同一であり、コードを同様のセクションに分割します。
VB.NETの完全なコード Imports System Imports System.Linq Imports Accord.Statistics.Models.Regression.Linear Imports Accord.IO Imports Accord.Math Imports System.Data Imports System.Collections.Generic Imports Accord.Controls Imports Accord.Math.Optimization.Losses Module Program Sub Main() 'for separating the training and test samples Dim traintPos As Integer = 18 Dim testPos As Integer = 22 Dim allData As Integer = testPos + (testPos - traintPos) 'for correct reading symbol of float point in csv Dim customCulture As System.Globalization.CultureInfo = CType(System.Threading.Thread.CurrentThread.CurrentCulture.Clone(), System.Globalization.CultureInfo) customCulture.NumberFormat.NumberDecimalSeparator = "." System.Threading.Thread.CurrentThread.CurrentCulture = customCulture 'read data Dim CsvFilePath As String = "msc_appel_data.csv" Dim mscTable As DataTable = New CsvReader(CsvFilePath, True).ToTable() 'for encoding the string values of months into numerical values Dim monthNames As Dictionary(Of String, Double) = New Dictionary(Of String, Double) From {{"January", 1}, {"February", 2}, {"March", 3}, {"April", 4}, {"May", 5}, {"June", 6}, {"July", 7}, {"August", 8}, {"September", 9}, {"October", 10}, {"November", 11}, {"December", 12}} Dim months As String() = mscTable.Columns("month").ToArray(Of String)() Dim dMonths As Double() = New Double(months.Length - 1) {} For i As Integer = 0 To months.Length - 1 dMonths(i) = monthNames(months(i)) Next 'select the target column Dim OutResPositive As Double() = mscTable.Columns("res_positive").ToArray() 'separation of the test and train target sample Dim OutResPositiveTrain As Double() = OutResPositive.[Get](0, traintPos) Dim OutResPositiveTest As Double() = OutResPositive.[Get](traintPos, testPos) 'deleting unneeded columns mscTable.Columns.Remove("total_appeals") mscTable.Columns.Remove("month") mscTable.Columns.Remove("res_positive") mscTable.Columns.Remove("year") 'add coded in a double column month into Table 'create new column Dim newCol As DataColumn = New DataColumn("dMonth", GetType(Double)) newCol.AllowDBNull = True 'add new column mscTable.Columns.Add(newCol) 'fill new column Dim counter As Integer = 0 For Each row As DataRow In mscTable.Rows row("dMonth") = dMonths(counter) counter += 1 Next 'receiving input data from a table Dim inputs As Double()() = mscTable.ToArray() 'separation of the test and train sample Dim inputsTrain As Double()() = inputs.[Get](0, traintPos) Dim inputsTest As Double()() = inputs.[Get](traintPos, testPos) 'simple linear regression model Dim ols = New OrdinaryLeastSquares() With {.UseIntercept = True} 'linear regression model for several features Dim regression As MultipleLinearRegression = ols.Learn(inputsTrain, OutResPositiveTrain) 'make a prediction Dim predicted As Double() = regression.Transform(inputsTest) 'console output For i As Integer = 0 To testPos - traintPos - 1 Console.WriteLine("predicted: {0} real: {1}", predicted(i), OutResPositiveTest(i)) Next 'And print the squared error using the SquareLoss class Console.WriteLine("error = {0}", New SquareLoss(OutResPositiveTest).Loss(predicted)) 'print the coefficient of determination Dim r2 As Double = New RSquaredLoss(numberOfInputs:=29, expected:=OutResPositiveTest).Loss(predicted) Console.WriteLine("R^2 = {0}", r2) 'alternative print the coefficient of determination Dim ur2 As Double = regression.CoefficientOfDetermination(inputs, OutResPositiveTest, adjust:=True) Console.WriteLine("alternative version of R2 = {0}", r2) Console.WriteLine("Press enter and close chart to exit") 'for chart Dim classes As Integer() = New Integer(allData - 1) {} Dim mountX As Double() = New Double(allData - 1) {} For i As Integer = 0 To allData - 1 If i < testPos Then mountX(i) = i + 1 classes(i) = 0 'csv data is class 0 Else mountX(i) = i - (testPos - traintPos) + 1 classes(i) = 1 'predicted is class 1 End If Next 'make points of chart Dim OutChart As List(Of Double) = New List(Of Double)() OutChart.AddRange(OutResPositive) OutChart.AddRange(predicted) 'plot chart ScatterplotBox.Show("res_positive from months", mountX, OutChart.ToArray(), classes).Hold() 'for pause Console.ReadLine() End Sub End Module
このプロジェクトは、Windows用のVisual StudioとLinux用のMonoDevelopの両方を使用してアセンブルできるため、非常にクロスプラットフォームであることが判明したことに注意してください。 確かに、これは本当です。C#に関してのみ、MonoでのVB.NETのコードは常に問題なくコンパイルされるとは限りません。
千の言葉ではなく、スクリーンショットを見てください。
VBプロジェクトバージョン1.0.1をビルドします。 Windowsで。
C#プロジェクトバージョン1.0.0をビルドします。 Linux Mintで。
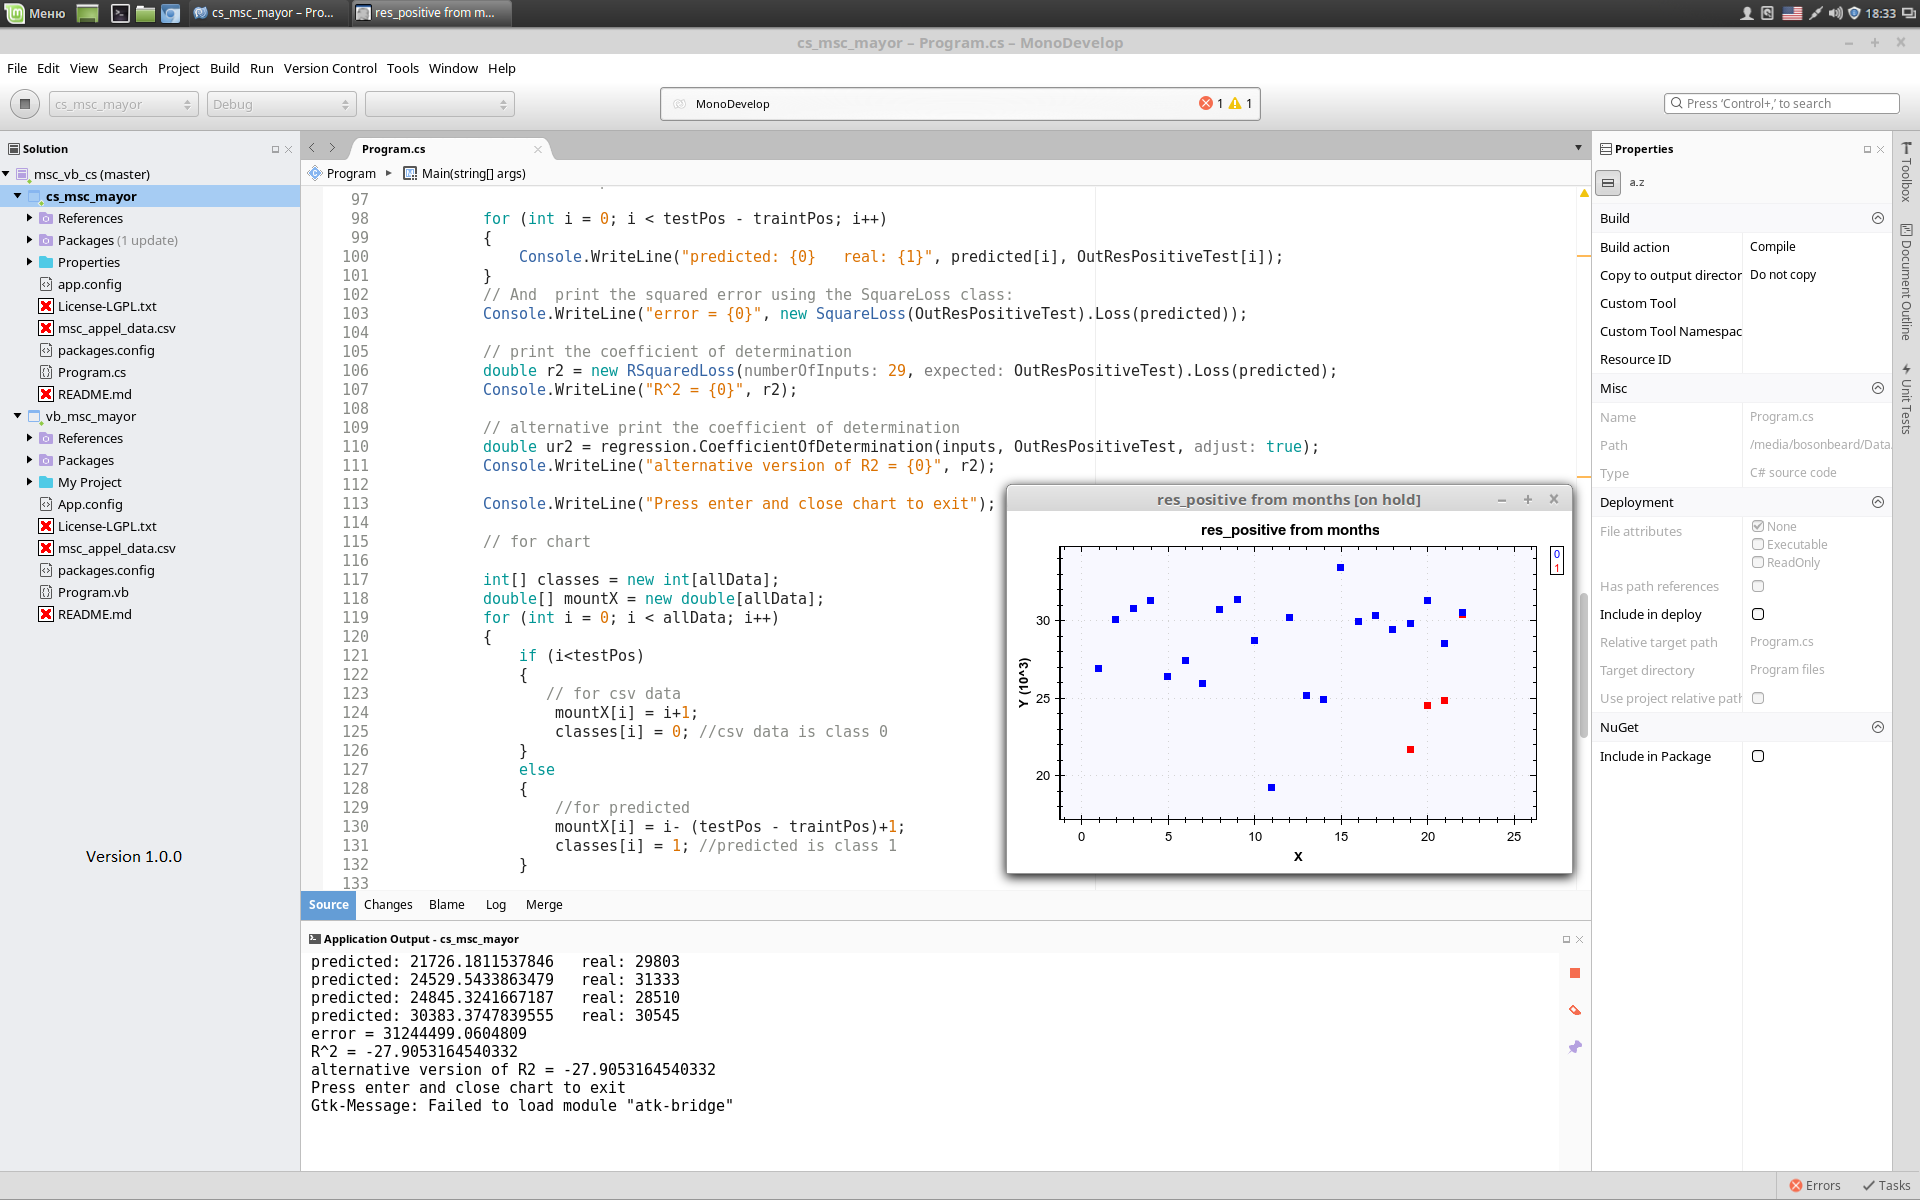
おそらく、写真の結果がわずかに異なることに気づいたでしょう。
これはMonoのせいではありません 。 問題は、Linux用にコンパイルされたC#のプロジェクトのバージョン(1.0.0)で、トランスコードされた列を月単位で考慮することを忘れていたことです。 そして、Visual StudioでアセンブルされたVB上のプロジェクト(1.0.1)のバージョンでは、考慮に入れました。
最初にスクリーンショットを修正したかったのですが、これはこの機能が予測の品質をわずかに改善するという明確なデモンストレーションだと思いました。
しかし、実際には、学業以外の利益をもたらさない悪い結果を達成しました。
この理由は次の要因でした。
- 持っているデータは異なる値になっていますが、スケールしませんでした。 (私はまだAccord.NETを使用してこれを行う方法を理解していないため) 。
- また、ほとんどすべての属性をモデルに詰め込みましたが、同時に「悪い」兆候の排除、つまり正則化を使用しませんでした。 (なぜだと思いますか?そうです、私もまだそれを理解していないからです) 。
- 確かに、作成するデータが少なすぎる、通常の予測があります。
知らないこともあります。しかし、幸いなことに、モデルの実用化を目標として設定していませんでした。フレームワークの存在を確認し、最も簡単なことを行うことが重要でした。次に、このツールを習得し、Accord.Netでの作業を学ぶことを願っています。