通常、Webサーバーからの情報を表示するには、データを監視システムにアップロードしてから
Grafanaに転送し
ます 。 どうやってそれを直接行うか、そしてゴールに向かう途中のいくつかのニュアンスについて-カットの下で。

免責事項
著者がGrafanaがインターフェースに使用する時代遅れのAngularJSの研究を掘り下げたくないこと、およびプラグイン開発ドキュメントがほぼ完全に欠如しているため、この記事には不正確な記述、ピーナッツの痕跡、その他のナッツが含まれる場合があります。
準備する
Grafanaのプラグインの開発は
JavaScript(es6)または
TypeScriptで行われ、
Node.jsを何らかのビルダーと組み合わせて使用することを意味します。
うなり声 。
典型的なプロジェクトフォルダーの内容/dist ... // . Grafana . /src /img logo.svg // , /partials // config.html // . , http. query.editor.html // . . datasource.js // module.js // plugin.json // - query_ctrl.js // , html- README.md // , Grafana gruntfile.js // LICENSE.txt // package.json // - Node.js , README.md // Node.js
まず最初に、
package.json 、
gruntfile.jsおよびその他のファイルを追加するプロジェクトフォルダーを作成します。
package.jsonのサンプルコンテンツ { "name": "-", "version": "0.1.0", "description": "--", "repository": { "type": "git", "url": "git+https://-github-" }, "author": "-", "license": "MIT", "devDependencies": { "babel": "~6.5.1", "grunt": "~0.4.5", "grunt-babel": "~6.0.0", "grunt-contrib-clean": "~0.6.0", "grunt-contrib-copy": "~0.8.2", "grunt-contrib-uglify": "~0.11.0", "grunt-contrib-watch": "^0.6.1", "grunt-execute": "~0.2.2", "grunt-sass": "^1.1.0", "grunt-systemjs-builder": "^0.2.5", "load-grunt-tasks": "~3.2.0", "babel-plugin-transform-es2015-for-of": "^6.6.0", "babel-plugin-transform-es2015-modules-systemjs": "^6.24.1", "babel-preset-es2015": "^6.24.1" }, "dependencies": {}, "homepage": "https://--" }
gruntfile.jsのサンプルコンテンツ module.exports = function(grunt) { require('load-grunt-tasks')(grunt); grunt.loadNpmTasks('grunt-execute'); grunt.loadNpmTasks('grunt-contrib-clean'); grunt.loadNpmTasks('grunt-build-number'); grunt.initConfig({ clean: ["dist"], copy: { src_to_dist: { cwd: 'src', expand: true, src: [ '**/*', '!*.js', '!module.js', '!**/*.scss' ], dest: 'dist/' }, pluginDef: { expand: true, src: ['plugin.json'], dest: 'dist/', } }, watch: { rebuild_all: { files: ['src/**/*', 'plugin.json'], tasks: ['default'], options: {spawn: false} }, }, babel: { options: { sourceMap: true, presets: ["es2015"], plugins: ['transform-es2015-modules-systemjs', "transform-es2015-for-of"], }, dist: { files: [{ cwd: 'src', expand: true, src: [ '*.js', 'module.js', ], dest: 'dist/' }] }, }, sass: { options: { sourceMap: true }, dist: { files: { } } } }); grunt.registerTask('default', [ 'clean', 'copy:src_to_dist', 'copy:pluginDef', 'babel', 'sass' ]); }
package.jsonの作成後、プロジェクトフォルダーで実行することにより、開発とコレクターに必要なすべての依存関係をインストールできます。
npm install --only=dev npm install grunt -g
その結果、約50MBの補助ファイルを含む
node_modulesフォルダーが作成され、配布フォルダーを
distフォルダーにビルドするために
gruntコマンドが使用可能になります。
次に、必要な構造を持つ
srcフォルダーを作成します。
plugin.jsonファイル
で 、プロジェクト
idを
--datasourceとして設定し、
metrics 、
alerting 、
annotations変数の値を設定することにより、提供する情報を設定します。
plugin.jsonの詳細については、
こちらを ご覧 ください 。
plugin.jsonのサンプルコンテンツ { "name": "-", "id": "--", "type": "datasource", "metrics": true, "alerting": false, "annotations": false, "info": { "description": "-", "author": { "name": "-", "url": "-" }, "logos": { "small": "img/logo.svg", "large": "img/logo.svg" }, "links": [ { "name": "GitHub", "url": "https://-github-" }, { "name": "", "url": "https://---" } ], "version": "0.1.0", "updated": "2018-05-10" }, "dependencies": { "grafanaVersion": "5.x", "plugins": [] } }
プラグインは、データソースまたは新しいタイプのパネルだけでなく、ソリューションのグループも実装できることに注意してください。 この場合、
plugin.jsonは
優れた構造になります。
html要素
/ src / partials フォルダーに、ソースへの接続時に表示されるブロックを含む
config.htmlファイルを追加し
ます 。 通常、httpの標準で十分です。
Config.htmlコンテンツ <datasource-http-settings current="ctrl.current"></datasource-http-settings>
一部のプラグインでは、メトリックの設定を含む
query.options.htmlを見つけることができます。
バージョン4.5以降
、これらの設定は
plugin.jsonから読み取られ
ます 。
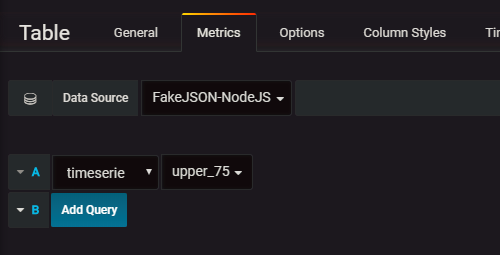
次のファイル
-query.editor.htmlは、メトリック(インターフェースの行)の設定方法を実装します。 通常、入力フィールドだけでなく、ドロップダウンリストを使用します。 Angularの場合、
ctrl.target.myprop変数に関連付けられたコンボボックスは次のようになります
<select ng-model="ctrl.target.myprop" ng-options="v.value as v.name for v in ctrl.myprops"> </select>
ctrl.myprops含まれる値のリストを非同期にロードする必要がある場合は、
コントローラーを作成する必要があります。
Grafanaには、適切な実装を持つコンポーネントが既にあります。
<gf-form-dropdown model="ctrl.target.myprop" class = "max-width-12" lookup-text="true" allow-custom = "false" get-options = "ctrl.getMyProps()" on-change = "ctrl.panelCtrl.refresh()" > </gf-form-dropdown>
ctrlは、現在のメトリックに関連付けられた
query_ctrl.jsによって実装されるクラスのオブジェクトです。
ctrl.targetには、リクエストでソースに送信されるメトリックプロパティが含まれます。
ctrl.panelCtrl.refresh()により、パネルは再びデータを要求します。
lookup-textは、ドロップダウンリストのフィールドでツールチップを使用できるかどうかを設定します。
ドロップダウンリストからではなくアイテムを選択
allow-customセット。
ドロップダウンリスト項目を取得する
get-optionsメソッド。 この場合、値またはプロミスとして返されるメソッドの結果は、
{text: "", value: ""}という形式の要素の配列でなければなりません。
model 、
get-optionsおよび
on-changeは、元の
ng-model 、
ng-optionsおよび
ng-changeとは異なることに注意してください。
gf-form-dropdown加えて、
metric-segment-modelもあり
metric-segment-model 。
ここで使用方法を見ることができ
ます 。 コンポーネントのドキュメントはありません。そのため、それらのリストと機能は、
ソースを調べることによってのみ見つけることができます。
query.editor.htmlの可能なコンテンツ <query-editor-row query-ctrl="ctrl" class="mydatasource-datasource-query-row"> <div class="gf-form-inline"> <div class="gf-form max-width-12"> <gf-form-dropdown model="ctrl.target.myprop" class = "max-width-12" lookup-text="true" custom = "false" get-options="ctrl.getMyProps()" on-change = "ctrl.updateMyParams()" > </gf-form-dropdown> </div> <div class="gf-form" ng-if = "ctrl.panel.type == 'graph'"> <label class="gf-form-label width-5">Name</label> <input type="text" ng-model="ctrl.target.label" class="gf-form-input width-12" spellcheck="false" > </div> <div class="gf-form" ng-if = "ctrl.target.myparams.length > 0"> <label class="gf-form-label width-5">Params</label> <input type="text" ng-repeat = "param in ctrl.target.myparams" ng-model="ctrl.target.myparams[param]" class="gf-form-input width-12" spellcheck="false" placeholder = "{{param}}" ng-change = "ctrl.panelCtrl.refresh();" > </div> <div class="gf-form gf-form--grow"> <div class="gf-form-label gf-form-label--grow"></div> </div> </div> </query-editor-row>
私はそれに注意する:
1.クラス
gf-form--growの最後の要素-growは、行の未割り当て部分を背景で塗りつぶすために必要です。
2.
ng-if = "ctrl.panel.type == 'graph'"条件付きで表示することにより、パネルのタイプに応じてメトリックラインに要素を追加/非表示にできます。
コード記述
module.jsファイルと
query_ctrl.jsファイルは非常にシンプルで、他のデータソースとの類推によって記述できます。
シンプルなJSON メインロジックは
datasource.jsにあります 。
このモジュールで説明するクラスは、少なくとも2つのメソッド
testDatasource()および
query(options)実装する必要があり
query(options) 。 1つ目は登録中にソースとの接続をテストするために使用され(「保存してテスト」ボタン)、2つ目はパネルがデータを要求するたびに呼び出されます。 これについて詳しく説明します。
クエリメソッドに渡されるオプションの例 { "timezone":"browser", "panelId":6, "dashboardId":1, "range":{ "from":"2018-05-10T23:30:42.318Z", "to":"2018-05-10T23:47:11.566Z", "raw":{ "from":"2018-05-10T23:30:42.318Z", "to":"2018-05-10T23:47:11.566Z" } }, "rangeRaw":{ "from":"2018-05-10T23:30:42.318Z", "to":"2018-05-10T23:47:11.566Z" }, "interval":"2s", "intervalMs":2000, "targets":[ { "myprop":"value1", "myparams":{ "column":"val", "table":"t" }, "refId":"A", "$$hashKey":"object:174" }, { "refId":"B", "$$hashKey":"object:185", "myprop":"value2", "myparams":{ "column":"val2", "table":"t2" }, "datatype":"table" } ], "maxDataPoints":320, "scopedVars":{ "__interval":{ "text":"2s", "value":"2s" }, "__interval_ms":{ "text":2000, "value":2000 } } }
上記の例から、すべてのメトリックのデータが同時に要求されていることが簡単にわかります。 主なフィールドは
rangeであり、これには情報が必要な期間が含まれます
query_ctrlはメトリックのリストです。各メトリックは
query_ctrl定義されたクラスオブジェクトの
targetプロパティに対応します。
targetsのリストは、「非表示」メトリックの結果を要求しないように、たとえば未定義のパラメーターを使用して明らかに「間違った」メトリックを削除するために、
hideプロパティでフィルター
targets必要があります。 次に、受信したリストに従って、各メトリックのデータが要求され、受信したメトリックは
Grafanaでサポートされている形式に変換する必要があります。
1つのメトリックの場合、答えはいくつかの結果、たとえば いくつかのグラフ。 それらを共通の配列に追加すると、最終的なセットに表示され、このメトリックまたはこの結果が取得されたメトリックにとって重要ではなくなります。
queryによって返されるデータ形式はパネルのタイプによって異なるため、グラフにデータが要求された場合、結果を
{target: -, datapoints: --[, ]}に変換する必要があります。
{columns: --{text: -, type: --}, rows: }Simple Jsonでは、形式
の選択は追加のメトリック属性によって解決されることが提案されていますが、これはあまり良くありません。
this.panel.typeに基づく
type属性を
targetオブジェクトに
this.panel.typeし、それに基づいて結果を変換することにより、これを自動的に行うことができるためです。 パネルタイプが
options渡されないのは少し奇妙です。
queryメソッドの結果は、
{data: -}を返すpromiseである必要があります。
データを要求するには、
backendSrv.datasourceRequest(options)メソッドを使用し
backendSrv.datasourceRequest(options) 。このメソッドは、選択したデータソースのタイプに応じて、データを
Grafanaにリダイレクトするか、ブラウザーで直接要求を実行します。
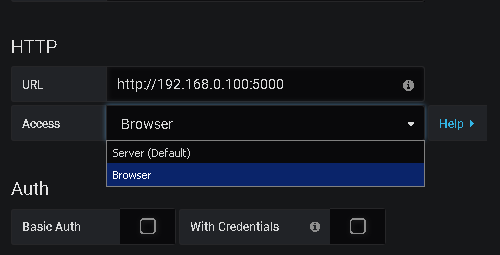
ブラウザーの場合、ポーリングされたWebサーバーは
CORSをサポートする必要があります。
すべてのメトリックの結果を取得するには、ソースに対して複数のクエリを実行する必要がある場合、
Promise.allを使用できます
Promise.all var requests = this.targets.map((target) => ... ); var scope = requests.map((req) => this.backendSrv.datasourceRequest(req)); return Promise.all(scope).then(function (results) {
データソースが変数をサポートするには、
metricFindQuery(options)メソッドを実装する必要があります。このメソッドは、
{text: "", value: ""}の形式の要素を持つ配列(おそらくpromiseを介して)を返します。 さらに、
query options.targetsを
options.targetsし、変数を置換できるすべてのプロパティのこの配列の各要素について、変換を実行する必要があります。
target.myprop = this.templateSrv.replace(target.myprop, options.scopedVars, 'regex');
注釈には、
annotationQuery(options)実装が必要です。
インストールと公開
インストールするには、
プラグインをWindowsの場合は
%GRAFANA_PATH%/ data / pluginsフォルダーに、または他のシステムの場合は
/ var / lib / grafana / pluginsに
コピーして、
Grafanaを再起動し
ます 。
使用可能なプラグインの
リストにプラグインを追加する場合は
、プラグインリポジトリにプルリクエストを
行うか、フォーラムを通じて開発者に連絡する必要があり
ます 。
参照資料