Micrometerは 、JVMアプリケーションメトリックを収集するために使用され、さまざまな監視システムにデータをエクスポートできます。 この記事では、Spring Webアプリケーション用にMicrometerを接続し、データを
Prometheusにエクスポートする方法について説明します(これに関する
良い投稿 )。 私のアプリケーションはSpring 3で書かれているため、アップグレードなしでSpringブートを使用することはできません。 したがって、手で作業する必要があります。
まず、Prometheusの依存関係、クライアント自体、およびデータをエクスポートするためのサーブレットが必要です。
pom.xml<dependency> <groupId>io.prometheus</groupId> <artifactId>simpleclient</artifactId> <version>0.6.0</version> </dependency> <dependency> <groupId>io.prometheus</groupId> <artifactId>simpleclient_servlet</artifactId> <version>0.6.0</version> </dependency>
次に、metletエクスポートサーブレットをweb.xmlに追加し、メトリックを使用できるパスを指定します。
<servlet> <servlet-name>prometheus</servlet-name> <servlet-class>io.prometheus.client.exporter.MetricsServlet</servlet-class> <load-on-startup>1</load-on-startup> </servlet> <servlet-mapping> <servlet-name>prometheus</servlet-name> <url-pattern>/metrics</url-pattern> </servlet-mapping>
必要に応じて、アクセスポリシーを追加することを忘れないでください。
<http pattern="/metrics" security="none"/>
localhost:8080 / metricsで統計が利用できるようになりますが、これまでは空白のページです。 データを表示するには、アプリケーションメトリックのコレクションを登録する必要があります。
Micrometerを使用するには、依存関係を追加します。
pom.xml <dependency> <groupId>io.micrometer</groupId> <artifactId>micrometer-core</artifactId> <version>1.1.3</version> </dependency> <dependency> <groupId>io.micrometer</groupId> <artifactId>micrometer-registry-prometheus</artifactId> <version>1.1.3</version> </dependency>
次に、必要なメトリックコレクタを登録する必要があります。
@WebListener public class PrometheusInitListener implements ServletContextListener { @Override public void contextInitialized(ServletContextEvent sce) { PrometheusMeterRegistry meterRegistry = new PrometheusMeterRegistry(PrometheusConfig.DEFAULT, CollectorRegistry.defaultRegistry, Clock.SYSTEM); new ClassLoaderMetrics().bindTo(meterRegistry); new JvmMemoryMetrics().bindTo(meterRegistry); new JvmGcMetrics().bindTo(meterRegistry); new ProcessorMetrics().bindTo(meterRegistry); new JvmThreadMetrics().bindTo(meterRegistry); } @Override public void contextDestroyed(ServletContextEvent sce) { } }
localhost:8080 / metricsに切り替えると、JVMでデータが取得されます。
次のようになります。
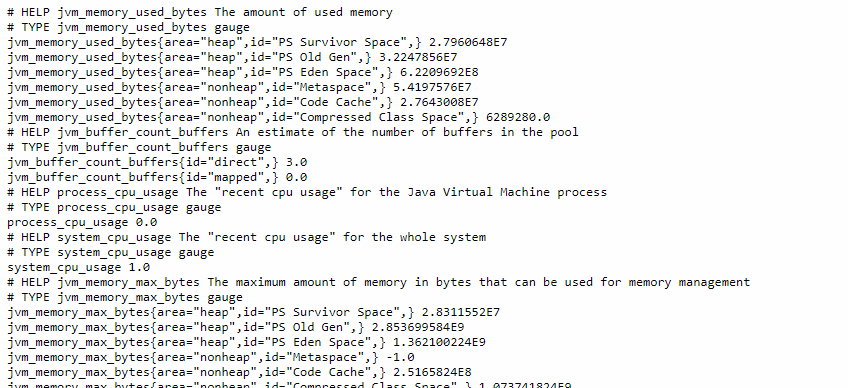
Prometheusには、
simpleclient_hotspotアプリケーションのJVM統計用の独自のライブラリがあり、DefaultExports.initialize()を呼び出すことで設定されます。 Webリスナーの初期化メソッド。
prometheus.ymlでメトリックコレクションを構成するには、ターゲットを追加します。
scrape_configs: - job_name: 'test-server' # Override the global default and scrape targets from this job every 5 seconds. scrape_interval: 5s metrics_path: /metrics static_configs: - targets: ['localhost:8080']
Prometheusで収集されたメトリックは、特別な言語PromQLを使用して表示できます。 Micrometrの利点は、何も記述できないが、メトリック可視化システムに既製のプラグインを使用できることです。
 Grafana、プラグイン4683でのアプリケーションメトリックの表示